10 ways Earth is interconnected
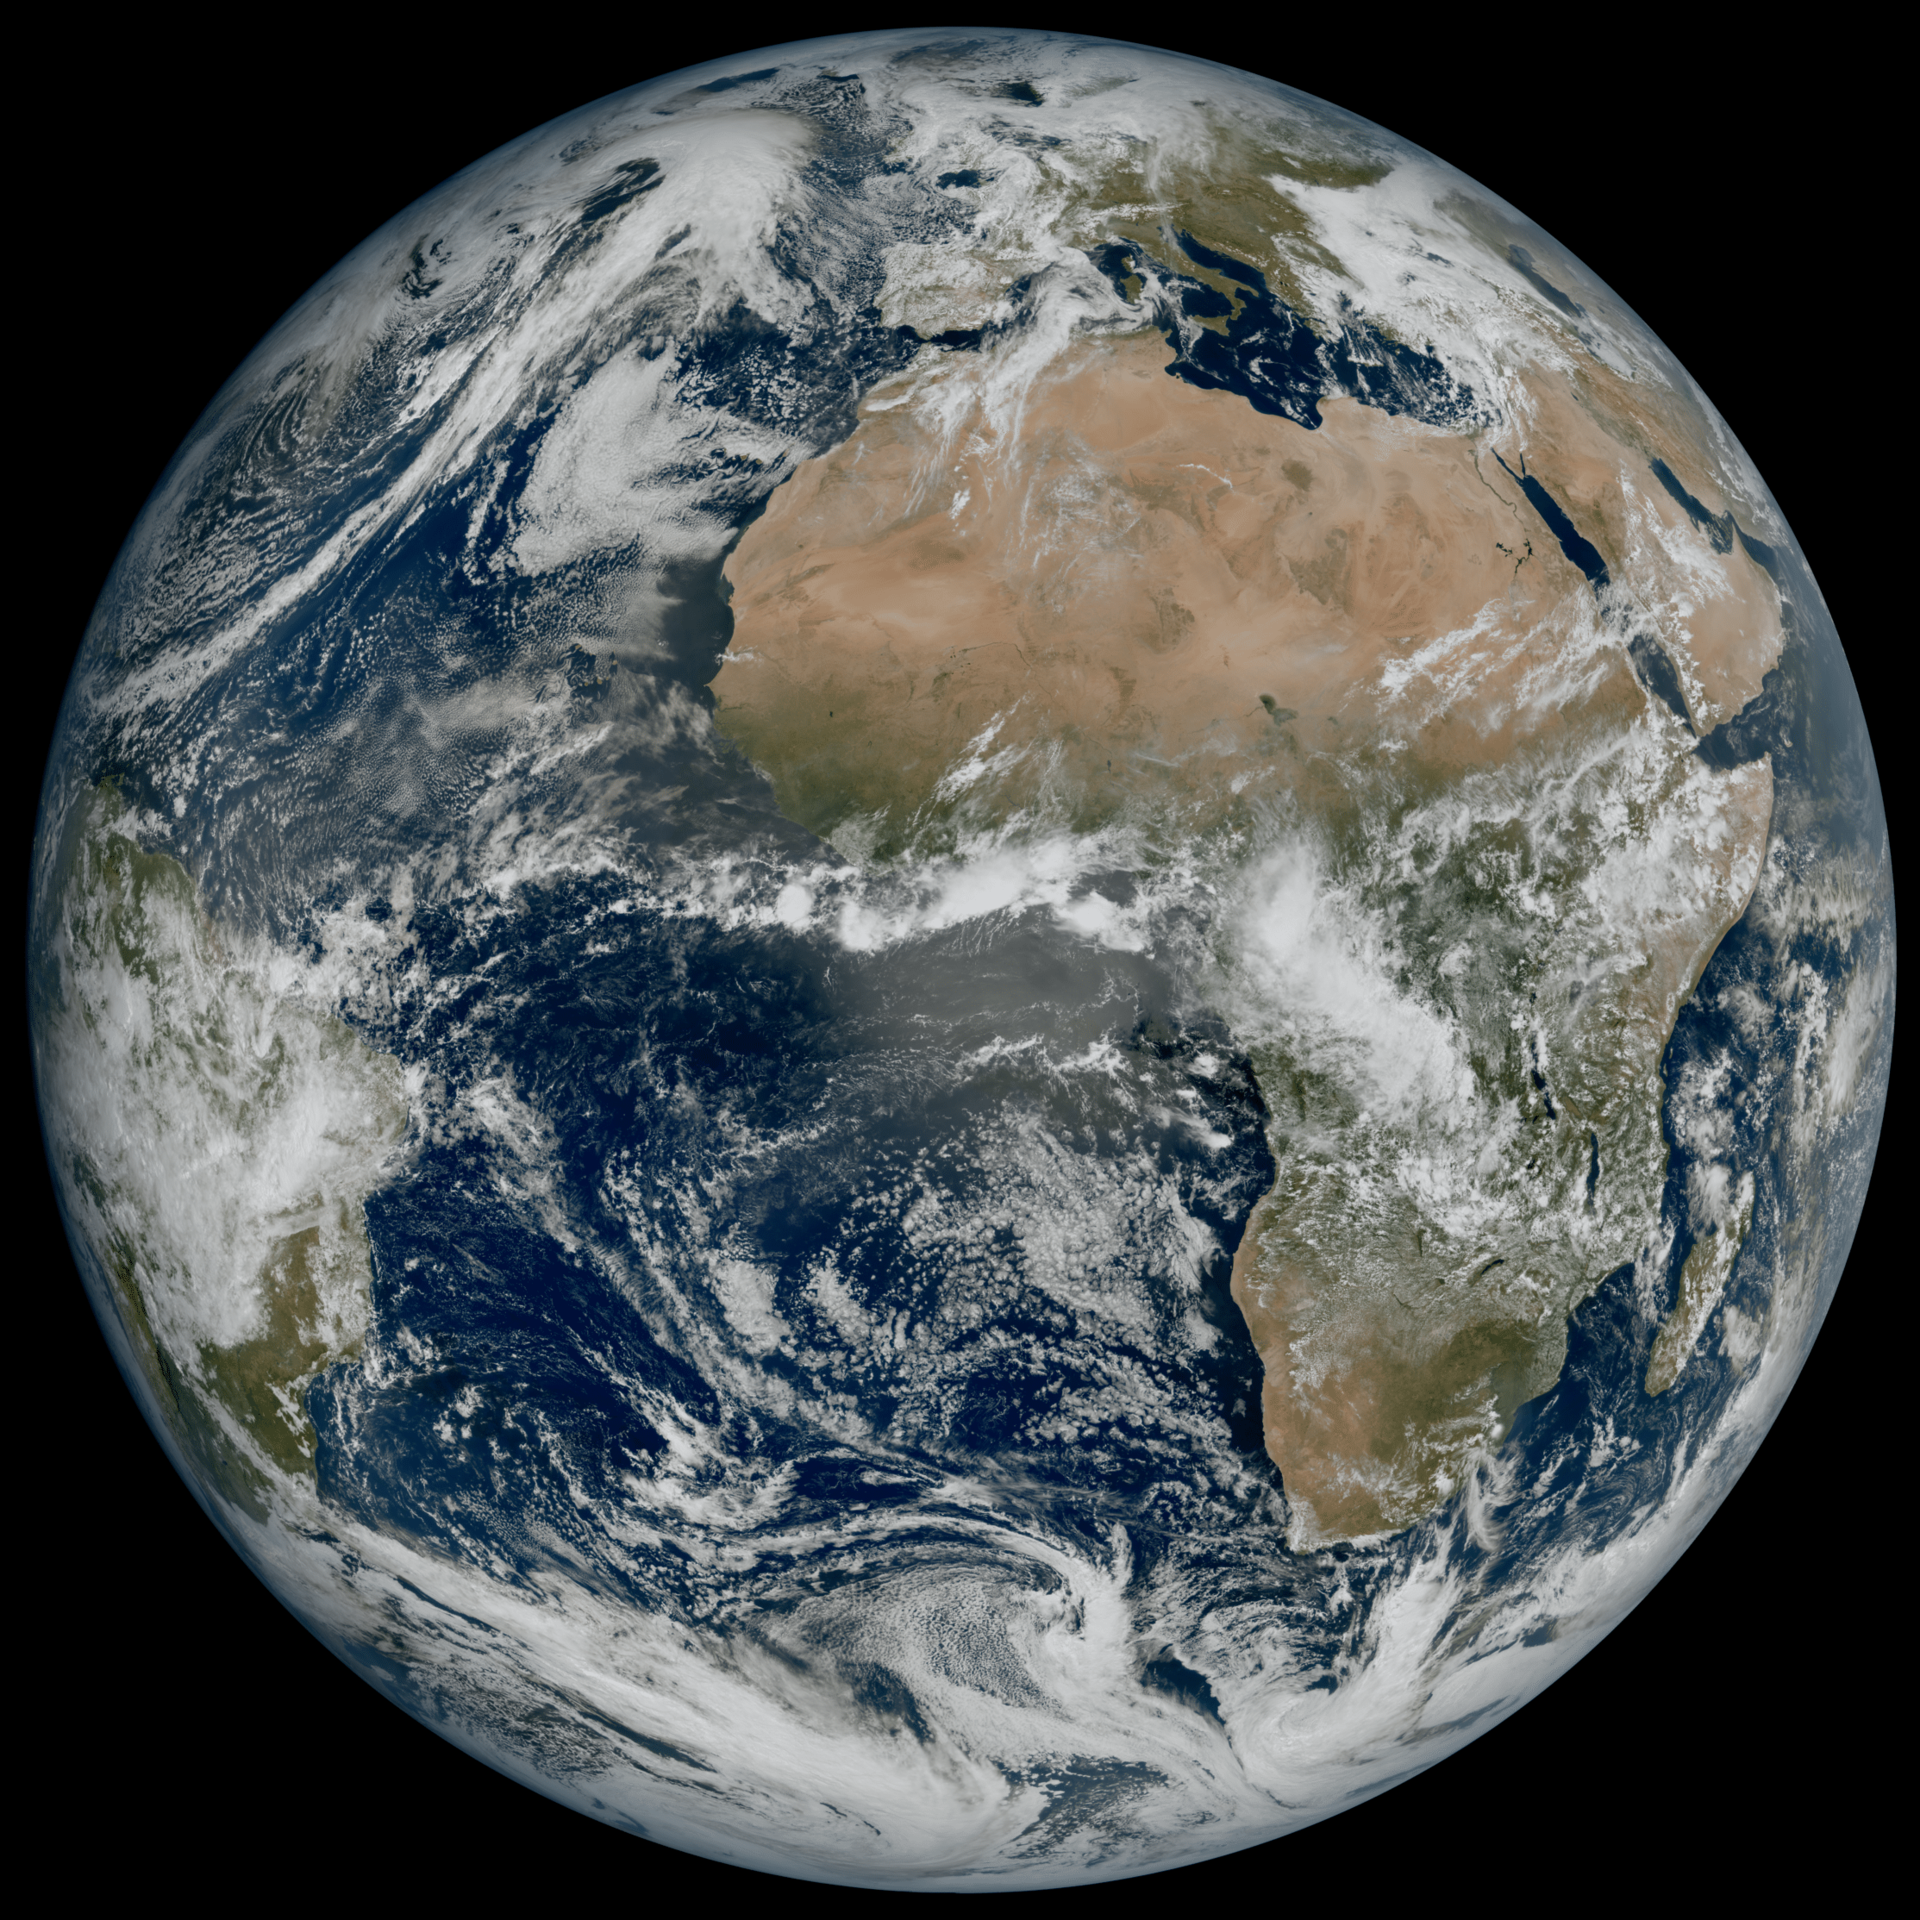
On this Earth Day, we reflect on the importance of protecting our planet for future generations. Understanding the Earth system and the complex interactions that shape our planet is paramount for addressing environmental challenges, mitigating climate change, preparing for natural disasters, managing resources sustainably and conserving biodiversity.
Each component of the Earth system – from the atmosphere and oceans to land surfaces and ice sheets – influences and interacts with one another in complex ways. ESA works all-year round to provide satellite data to monitor the health of our planet. Here are 10 examples of how Earth’s systems intertwine and how satellite measurements are key to understanding these complex processes.
1) What happens in the Arctic doesn’t stay in the Arctic
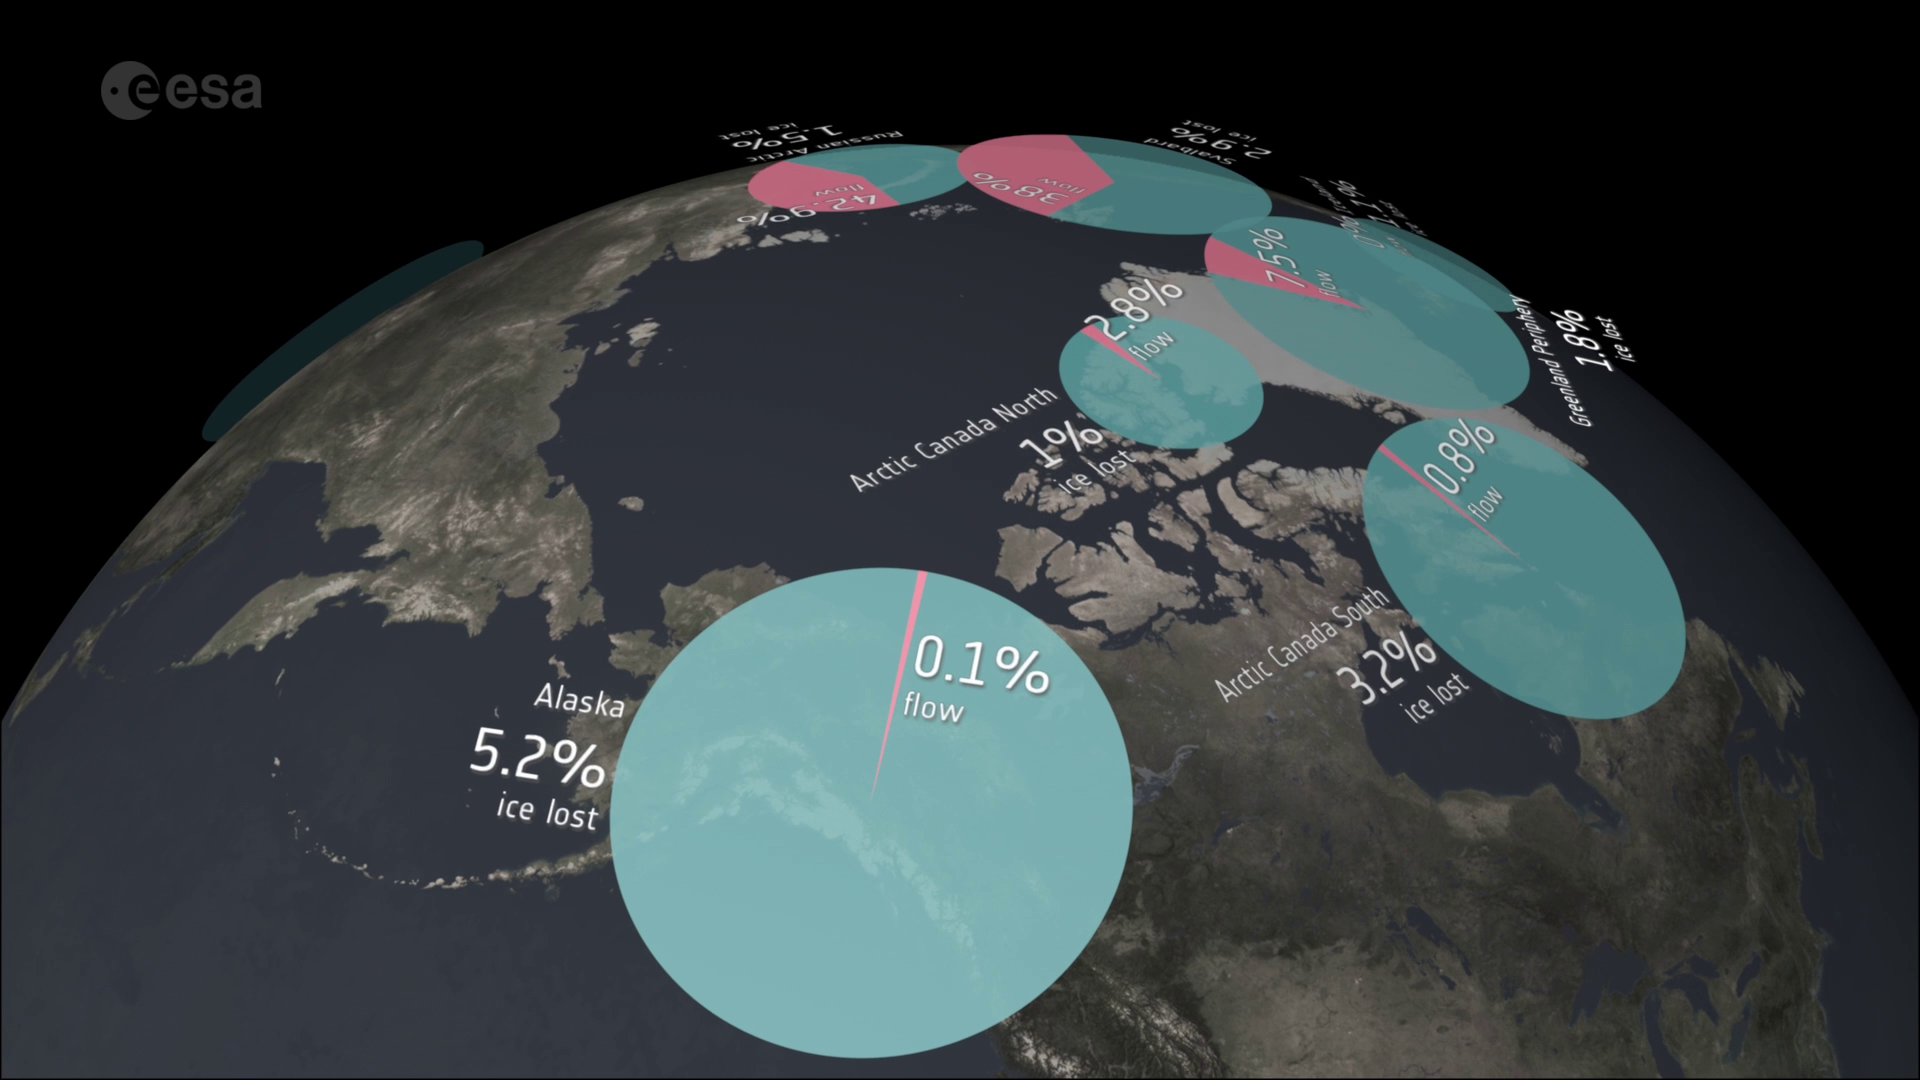
The Arctic, often viewed as a distant and isolated region, plays a crucial role in shaping global climate patterns. Arctic amplification refers to the phenomenon where the Arctic experiences a faster rate of warming than the rest of the planet. This warming, which is at least twice the global average, has profound implications for the stability of Earth’s climate system, particularly regarding sea level rise.
As temperatures in the Arctic continue to rise, the region's vast expanses of sea ice are rapidly melting. The Arctic’s ice caps and glaciers are also experiencing accelerated melting, which directly contribute to rising sea levels worldwide.
The loss of reflective ice cover means that more of the Sun’s energy is absorbed by the darker ocean surface, rather than being reflected back into space.
This absorption of solar energy exacerbates global warming, creating a feedback loop known as the ice-albedo feedback. As more ice melts, more solar energy is absorbed, leading to even more warming and ice loss—a self-reinforcing cycle that amplifies the effects of climate change.
Satellites developed by ESA have become indispensable tools in understanding and addressing the complex dynamics at play and the far-reaching consequences for the environment and human societies.

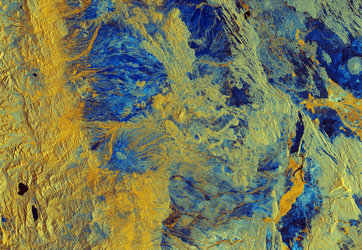
2) Thawing permafrost: what lies beneath?
Beneath the frozen surface of the Arctic lies vast expanses of permafrost which acts as a giant freezer storing organic matter including nearly 1700 billion tonnes of carbon – almost double the amount of carbon currently in Earth’s atmosphere. This makes permafrost a critical player in the global carbon cycle.
However, as temperatures in the Arctic rapidly rise, the frozen ground thaws, releasing gases like methane and carbon dioxide into the atmosphere. Emissions from permafrost thaw are usually buffered by more efficient uptake of methane by soil and plants, however there are indications that emissions are out-pacing these uptake processes.
The release of these gases creates a feedback loop that exacerbates climate change: as more methane is released, global temperatures rise further, leading to more permafrost thaw and additional methane release—a self-reinforcing cycle that amplifies the impacts of climate change.
Although permafrost cannot yet be directly measured from space, a lot of different types of satellite data, along with ground measurements and modelling, allow scientists to paint a picture of permafrost.
Factors like surface temperature, land cover and snow parameters can be captured by satellites. These data combined allows us to put together a picture of how permafrost ground conditions are changing over time.

Access the video
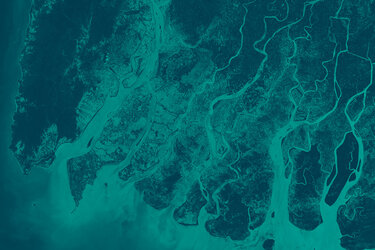
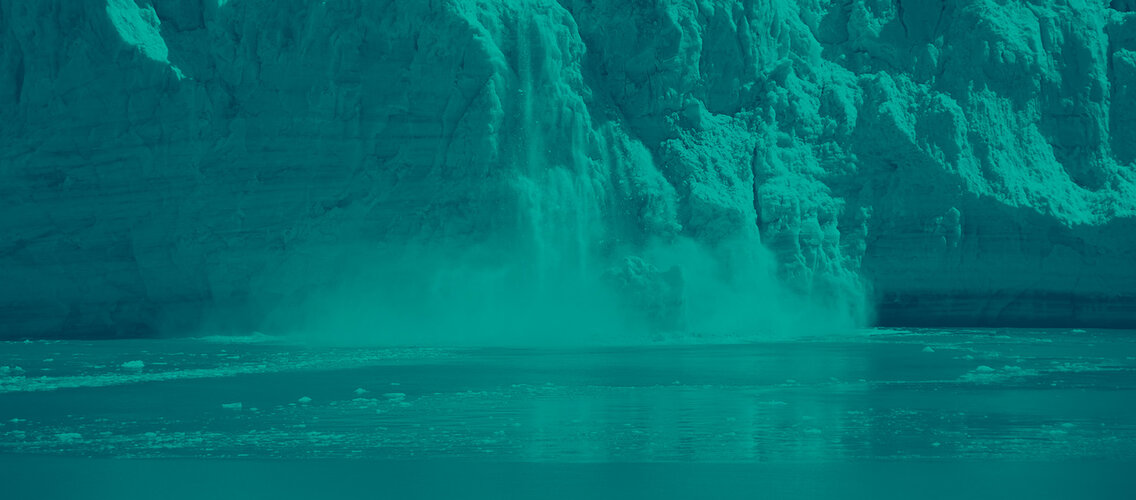
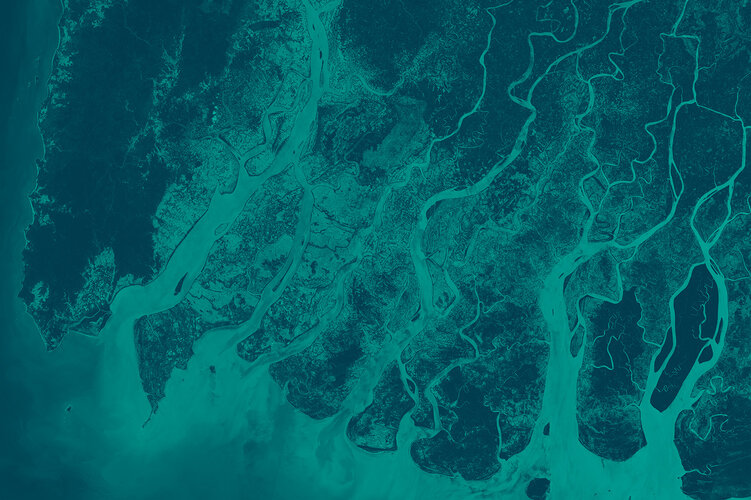
3) Melting glaciers and water supply
Glaciers are found on all continents except Australia and provide an essential source of freshwater. For example, glaciers in high-mountain Asia alone provide much needed water for over 1.3 billion people.
Glaciers are melting due to warmer air and ocean temperatures, losing mass through melting and calving into lakes or oceans. In the last decade, nearly 90% of global glacier loss was due to warmer air temperature.
The loss of glaciers worldwide is affecting water supplies for the people who rely on glacier-fed rivers for drinking water, agriculture and even hydropower. Many regions rely on glacier-fed rivers during the dry season when water scarcity is already a concern.
In addition, ice being lost from glaciers is contributing more to sea-level rise than the ice being lost from either of the giant ice sheets on Greenland and Antarctica.
As glaciers lie in complex rugged terrain, there are numerous practical challenges in mapping and monitoring glaciers. From space, we can map glacier extent and how their thickness is changing.
Thanks to ESA’s CryoSat satellite and a breakthrough way of using its data, scientists recently discovered that glaciers worldwide have shrunk by a total of 2% in just 10 years, because of higher air temperatures.
Access the video
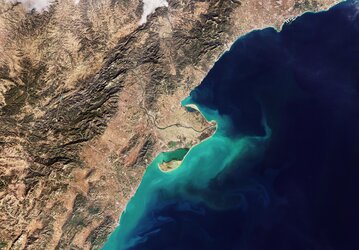
4) Carbon dioxide and ocean health
Our oceans are not immune to the consequences of human-induced climate change. As the concentration of carbon dioxide rises in the atmosphere, Earth’s oceans also absorb more carbon dioxide – changing the chemistry of ocean water. These processes are leading to a decrease in the pH of seawater, in a process known as ocean acidification.
The more acidic water poses a grave threat to coral reefs and the delicate balance of marine ecosystems, making it harder for sea shells and other calcifying organisms to build and maintain their structures, which will ultimately lead to cascading effects that have the potential to be felt worldwide.
A recent study highlights just how satellites are becoming increasingly important in providing unique information on ocean health to guide climate mitigation and adaptation efforts.

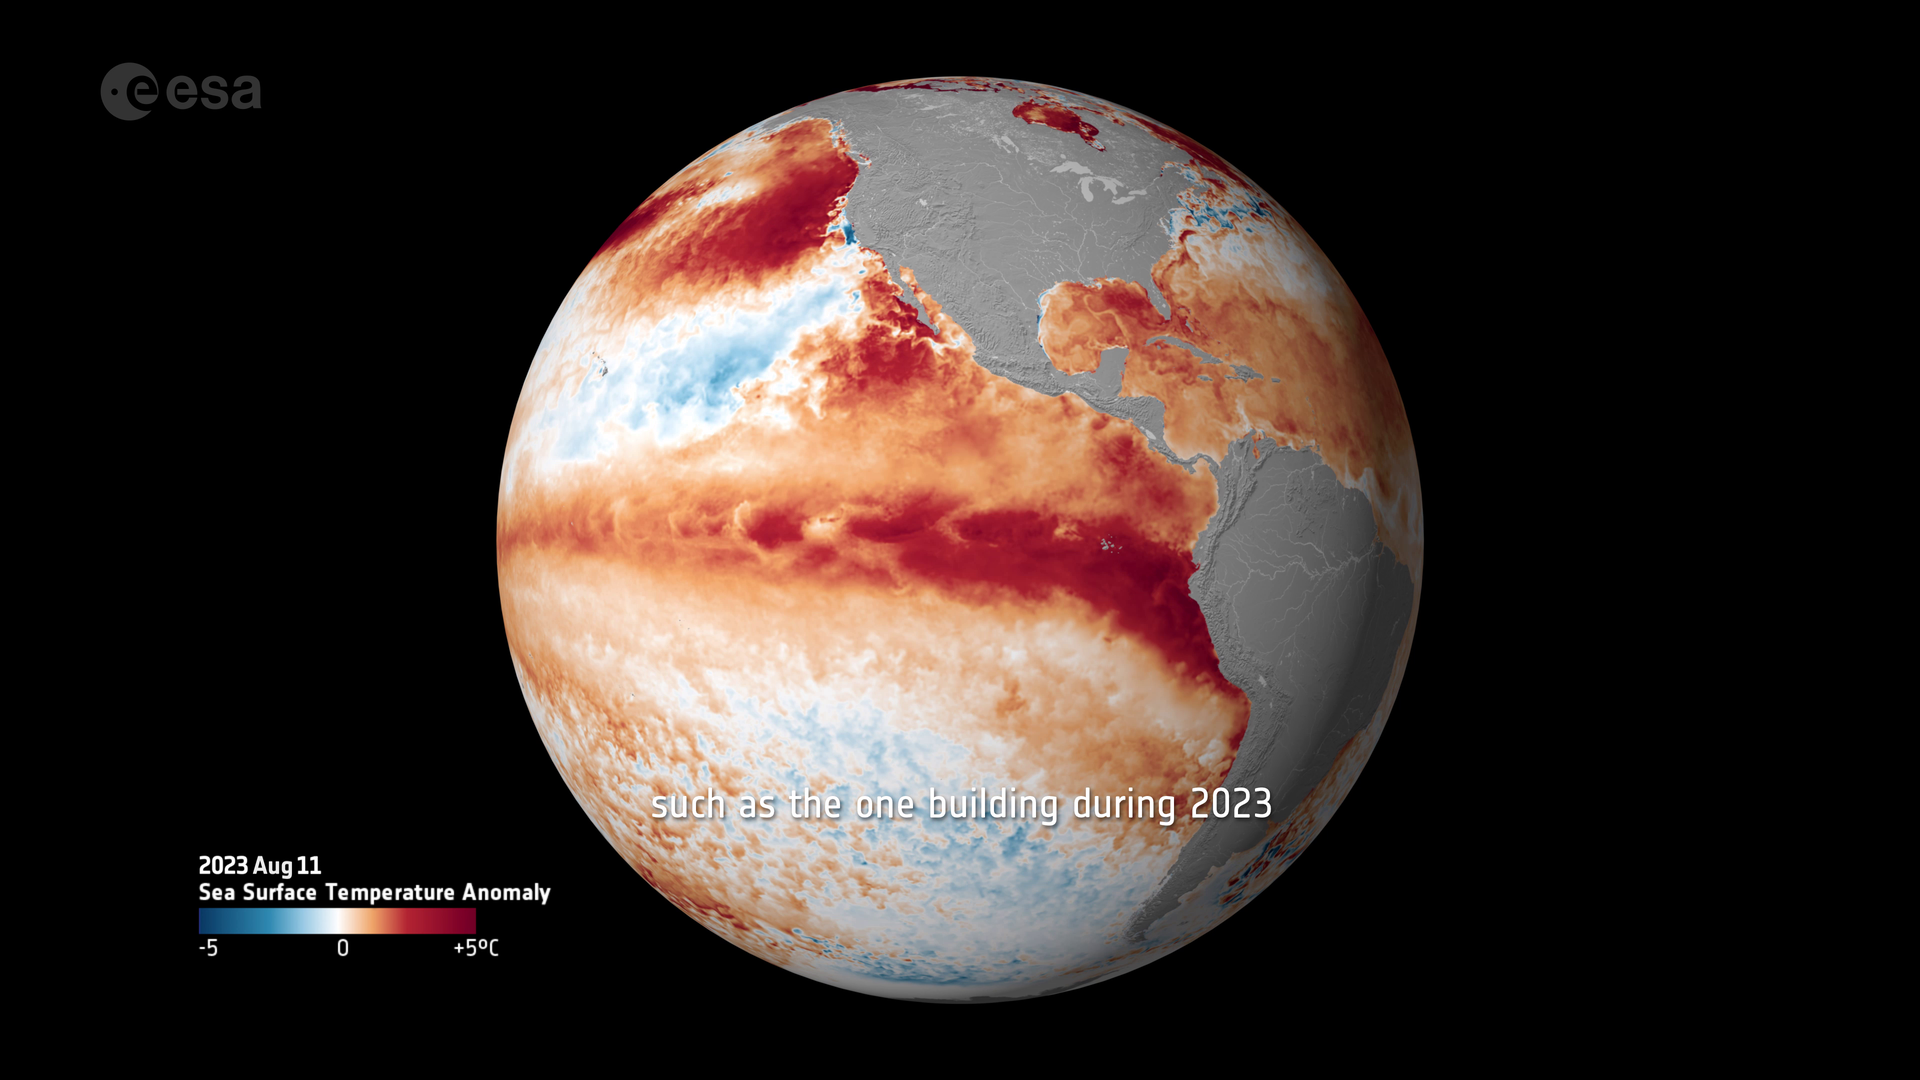
5) The global reach of El Niño
El Niño, a climate phenomenon characterised by warmer-than-average sea surface temperatures in the Pacific Ocean, has far-reaching effects on weather patterns worldwide.
During El Niño events, the normal atmospheric circulation patterns across the Pacific are disrupted, leading to changes in rainfall, temperature and atmospheric circulation patterns across the globe.
These impacts can include droughts in some regions and heavy rainfall and flooding in others. El Niño events can also influence the intensity and distribution of tropical cyclones, affecting coastal communities and economies.
According to the World Meteorological Organization, the 2023-24 El Niño has peaked as one of the five strongest on record. Although it is now gradually weakening, it will continue to impact the global climate in the coming months.
While climate models have historically used sea surface temperatures to simulate the development of El Niño, incorporating sea surface salinity data can further improve the prediction of the timing, duration and intensity of El Niño events.
ESA’s Climate Change Initiative recently released a new salinity dataset, which integrates measurements from ESA’s Soil Moisture and Ocean Salinity (SMOS) mission into one globally consistent record. This record allows the scientific community to assess the state of the ocean, monitor variations related to climate variabilities and investigate the linkage with different elements of the water cycle.
Access the video
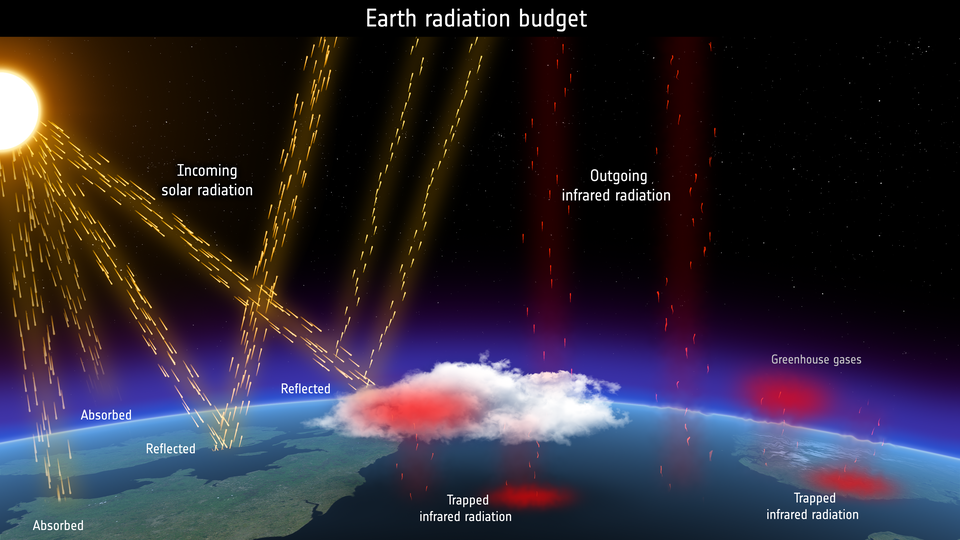
6) Clouds and aerosols: nature’s atmospheric regulators
Clouds and aerosols play a crucial role in regulating Earth's climate by influencing the planet's energy balance.
Clouds, which are primarily composed of water droplets, reflect sunlight back into space and trap heat radiating from Earth's surface. The net effect of these processes determines whether clouds have a warming or cooling effect on the climate.
Aerosols are minute solid or liquid particles suspended in the atmosphere, originating from natural sources like volcanic eruptions and wildfires, as well as human activities such as industrial processes and vehicle emissions. Aerosols both reflect and absorb incoming solar radiation, and trap outgoing heat radiation. Aerosols also act as nuclei for cloud formation.
While scientists know that clouds and aerosols play extremely important roles in both cooling and warming our atmosphere, there remains uncertainty when it comes to accounting for the exact influence they have on Earth’s energy balance in the future, given the ongoing climate crisis.
Understanding the feedback loops involving clouds and aerosols is vital for assessing Earth’s energy balance and accurate climate predictions. Their roles in regulating the energy balance, influencing regional climate patterns, and driving feedback mechanisms underscore their importance in climate science.
ESA’s EarthCARE satellite, set to launch in May, is designed to deliver a wealth of data that will further our understanding of this important area of science.
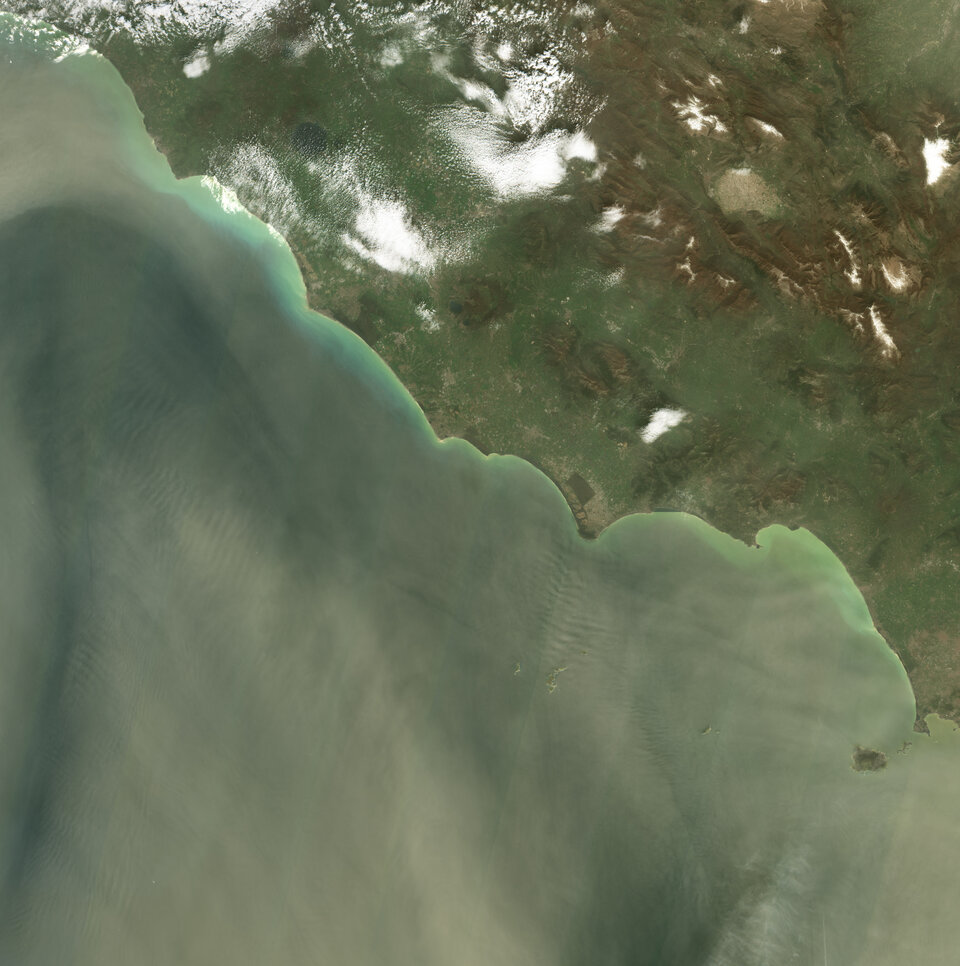
7) Saharan dust and the transcontinental journey
Every year, winds sweep vast quantities of dust from the Sahara Desert across the Atlantic Ocean. While seemingly remote, this phenomenon significantly impacts ocean ecosystems thousands of kilometres away.
As Saharan dust settles over the Atlantic, it brings essential nutrients like iron and phosphorus, acting as fertilisers for marine organisms. These nutrients trigger phytoplankton blooms—microscopic algae that form the basis of marine food webs – that can store vast amounts of carbon.
However, Saharan dust can also have adverse effects, especially when large quantities are transported over long distances. These dust clouds can reduce air quality, causing respiratory problems and exacerbating health issues.
When deposited in sensitive ecosystems such as coral reefs, Saharan dust may introduce pollutants and pathogens, potentially harming marine life.
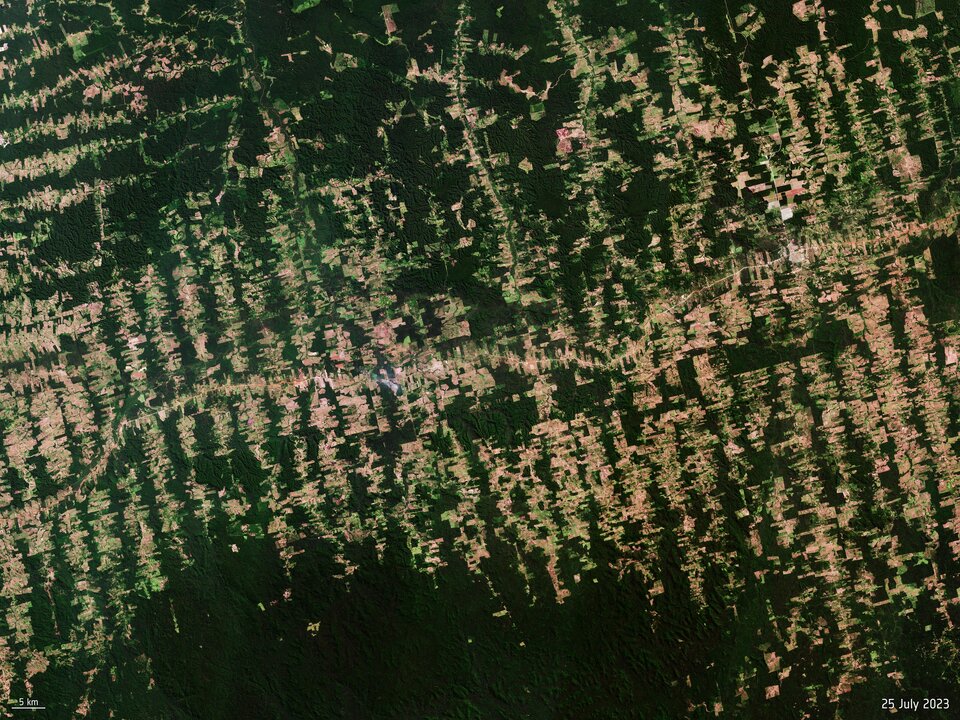
8) Tropical forests and the global carbon cycle
Tropical forests are pivotal in global climate regulation. Through photosynthesis, forests absorb significant amounts of carbon dioxide, mitigating the impacts of climate change.
However, forest degradation and deforestation are causing much of this stored carbon to be released back into the atmosphere. The change in land cover is reducing regional evapotranspiration and altering rainfall formation, disrupting atmospheric circulation patterns.
Climate change exacerbates these challenges, leading to more frequent and severe droughts, heatwaves and even wildfires in tropical rainforests.
Understanding how much carbon tropical forests absorb from the atmosphere, store and release is difficult to calculate. Satellites can provide countries with independent information to show how their forests change over time, which allows rates of carbon flux to be estimated. These measurements can then be compared to results reported in National Greenhouse Gas Inventories.
9) Forest fires and carbon emissions
Forest fires are a crucial part of the carbon cycle and an important component of many forest ecosystems. But as temperatures rise and weather patterns become more extreme, forests are increasingly susceptible to ignition and the rapid spread of larger and more intense wildfires, with temperate and boreal forests seeing a rapid rise in burned area since 2001.
These fires release vast amounts of carbon dioxide into the atmosphere – exacerbating global warming until their regrowth can return the carbon back into the forest.
In addition to their role in the carbon cycle, forest fires have immediate and direct impacts on human health. The smoke generated by wildfires contains a complex mixture of pollutants, including particulate matter and carbon monoxide, which can degrade air quality and pose significant health risks.
The relationship between forest fires and climate change has feedback loops that act on different timescales. As the climate warms, many forests are becoming drier and more prone to ignition, leading to more frequent and severe wildfires.
These fires, in turn, release more carbon dioxide into the atmosphere, intensifying global warming and creating conditions conducive to even more fires. Most forests are also responding to climate change by growing more quickly in the warmer climate, with their growth also boosted by higher levels of carbon dioxide in the atmosphere. Whilst this faster growth is removing more carbon from the atmosphere, it is also producing a larger fuel supply for wildfires to burn through.
ESA’s World Fire Atlas maps the distribution of individual fires taking place at both a national and global scale. Through its interactive dashboard, users can compare the frequency of fires between countries as well as analyse the evolution of fires taking place over time, thanks to data from the Copernicus Sentinel-3A satellite.
10) Running AMOC – the Atlantic Meridional Overturning Circulation and climate patterns
The Atlantic Meridional Overturning Circulation (AMOC) is a critical oceanic conveyor belt system that transports heat from the tropics to the North Atlantic. This process helps regulate global climate patterns, influencing weather, ocean circulation and marine ecosystems worldwide.
However, some studies suggest that climate change is weakening the AMOC, primarily due to increased freshwater input from melting polar ice.
The potential consequences depend on how much the AMOC weakens. Some regions in the Atlantic could experience a rise in sea levels, Europe could see colder winters and altered precipitation patterns. The consequences of AMOC disruption could extend far beyond the Atlantic region, affecting weather patterns in North America, Africa and beyond.
Most studies of the AMOC use computer models and historical data to predict the AMOC’s collapse. Satellite instruments like the Copernicus Sentinel-6 satellite measure changes in sea surface height, while Sentinel-3 contributes to monitoring ocean sea surface temperature, geostrophic circulation and sea ice distribution, and ESA’s SMOS mission takes a closer look at salinity.
Combined, these instruments provide crucial parameters for understanding the density and movement of ocean waters.
ESA is actively shaping its programme to better understand Earth system science. In addition to understanding our Earth better, ESA satellites will also help address the urgent challenges of climate change and help develop and provide innovative solutions and contribute to informed decision-making for a sustainable future.