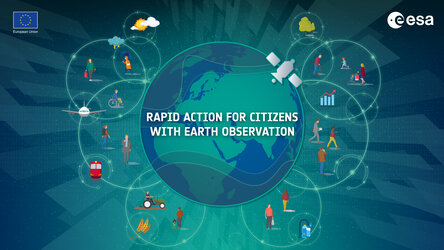
'Rapid Action Coronavirus Earth observation' dashboard now available
The coronavirus pandemic constitutes an unprecedented challenge with severe societal and socio-economic consequences. In order to shed new light on these changes taking place, ESA and the European Commission have worked closely together to create the ‘Rapid Action Coronavirus Earth observation’ dashboard. The platform, which was unveiled today during an online event, uses Earth observation satellite data to measure the impact of the coronavirus lockdown and monitor post-lockdown recovery.
The dashboard allows for the monitoring of key environmental parameters – such as air and water quality changes, economic and human activities including industry, shipping, construction, traffic, as well as agricultural productivity.
One of the platform’s features allows for the tracking of air pollution worldwide. Using data from the Copernicus Sentinel-5P satellite, the map shows the averaged nitrogen dioxide concentrations over major cities and regions across the world.

The dashboard also shows how artificial intelligence can be used to monitor economic indicators. ESA’s Director for Earth Observation, Josef Aschbacher, presented two examples of how the combination of artificial intelligence along with commercial satellite data can be used to monitor production changes in the volume of cars at a car manufacturer in Germany, as well as the monitoring of plane traffic at Barcelona Airport.
Josef Aschbacher comments, “Unique data from space are pivotal in supporting crisis management during the coronavirus pandemic. In response to this, I am happy to announce the collaboration between ESA and the European Commission in order to help support Europe both now, and during, the economic reboot.
“Europe has excellent world-class Earth observation capabilities and we are glad to provide it for the benefit of European and global citizens. The Copernicus programme, together with ESA Earth observation programmes, are sources of vast economic and societal benefits. Across all European countries and ESA Member States, the dashboard showcases examples of how Earth observation data can illustrate both socio-economic and environmental changes.”
He continues, “Over the following months, the dashboard will be expanded to monitor additional sites across Europe and will be enriched with new data provided by the Copernicus Sentinels and Third Party Missions.”
Pierre Delsaux, European Commission’s Deputy Director General for Defence Industry and Space added, “The tool that we launched today proves the significant potential and versatility of the EU space programme and its contribution to the ambitions of a green, resilient and modern Europe. Space is a strategic sector for the EU, for our resilience and strategic autonomy. The dashboard shows the role that the EU Space Programme can play for Europe’s sustainable, long-term recovery.”


Access the video
The dashboard not only includes data provided by the Copernicus Sentinels and ESA Third Party Missions, but also includes contributions from Aerospacelab, Airbus, BIRA-IASB, e-GEOS, CNR ISMAR, EarthPulse, ECMWF, EMSA, EOX, Euro Data Cube, GMV, ICEEYE, KNMI, KSAT, Mundi Web Services, Planetek Hellas, RHEA, SERCO, S&T, S5P PAL, SEN4CAP, Sen4Stat, Sinergise, SISTEMA, SPACEKNOW, SRON, UCLouvain, University of Bremen and Vodafone.
The dashboard can be accessed here: https://race.esa.int/
About the Copernicus Sentinels
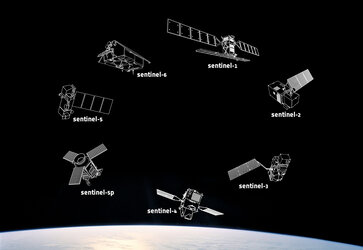
The Copernicus Sentinels are a fleet of dedicated EU-owned satellites, designed to deliver the wealth of data and imagery that are central to the European Union's Copernicus environmental programme. The European Commission leads and coordinates this programme, to improve the management of the environment, safeguarding lives every day. ESA is in charge of the space component, responsible for developing the family of Copernicus Sentinel satellites on behalf of the European Union and ensuring the flow of data for the Copernicus services, while the operations of the Copernicus Sentinels have been entrusted to ESA and EUMETSAT.


 Germany
 Austria
 Belgium
 Denmark
 Spain
Spain
 Estonia
 Finland
 France
 Greece
 Hungary
 Ireland
 Italy
Italy
 Luxembourg
 Norway
 The Netherlands
 Poland
 Portugal
 Czechia
 Romania
 United Kingdom
 Slovenia
 Sweden
 Switzerland


