Little Pictures winner announced at COP28
The winning entry to a Europe-wide data visualisation contest was announced and showcased last week at COP28. The ‘Little Pictures’ competition challenged the continent’s creative talent to design compelling illustrations using the range of global observation records available from ESA, the European Organisation for the Exploitation of Meteorological Satellites (Eumetsat) and European Centre for Medium-Range Weather Forecasts (ECMWF), to highlight the key changes taking place across the climate.
The winning ‘Little Picture’, created by scientific illustrator Sacha Berna of the University of Caen, France, highlights the expansion of Brazil’s urban area between 2000–2015 and compared it to the changes in rainforest coverage.
To create the Little Picture, Sacha drew on satellite-derived land cover information generated by ESA’s Climate Change Initiative. Land cover – the bio-physical surface of Earth’s land area – and its change over time is known to influence regional and global climate by modifying exchange of water, energy and greenhouse gases with the atmosphere. It is considered to be one of just 54 key variables used to characterise the Earth climate system.
Sacha explains her reason for taking part in the competition: “My day job involves conveying scientific information that is easily understood and engaging for the general public. The competition gave me an opportunity to try visualising the same data that are being used to understand the Earth system and inform decision-making to protect humanity’s future.”

A picture paints a thousand words
The competition attracted close to 500 entries on the run up to COP28, with the quality of Little Pictures submitted being very high. The results were judged by representatives of each organisation plus leading data journalist Matthias Stahl of Der Spiegel newspaper and Professor Ed Hawkins of the University of Reading - the creator of the famous Show Your Stripes visualisation.
“The range of climate variables that were chosen to be visualised was particularly striking,” notes Prof Hawkins, who adds, “This could be a reflection the growing suite of observation datasets now available but also growing public consciousness of the impacts climate change that are affecting every region on Earth, in multiple ways.”
Showcase of climate impacts
Of the 10 runners up, the visualisations incorporated data on rising atmospheric carbon dioxide levels; the knock-on upward global monthly temperature trend between 1940-2023, illustrated by Neil Kaye, climate data scientist at the UK’s Met Office using ECMWF’s ERA5 reanalysis data.
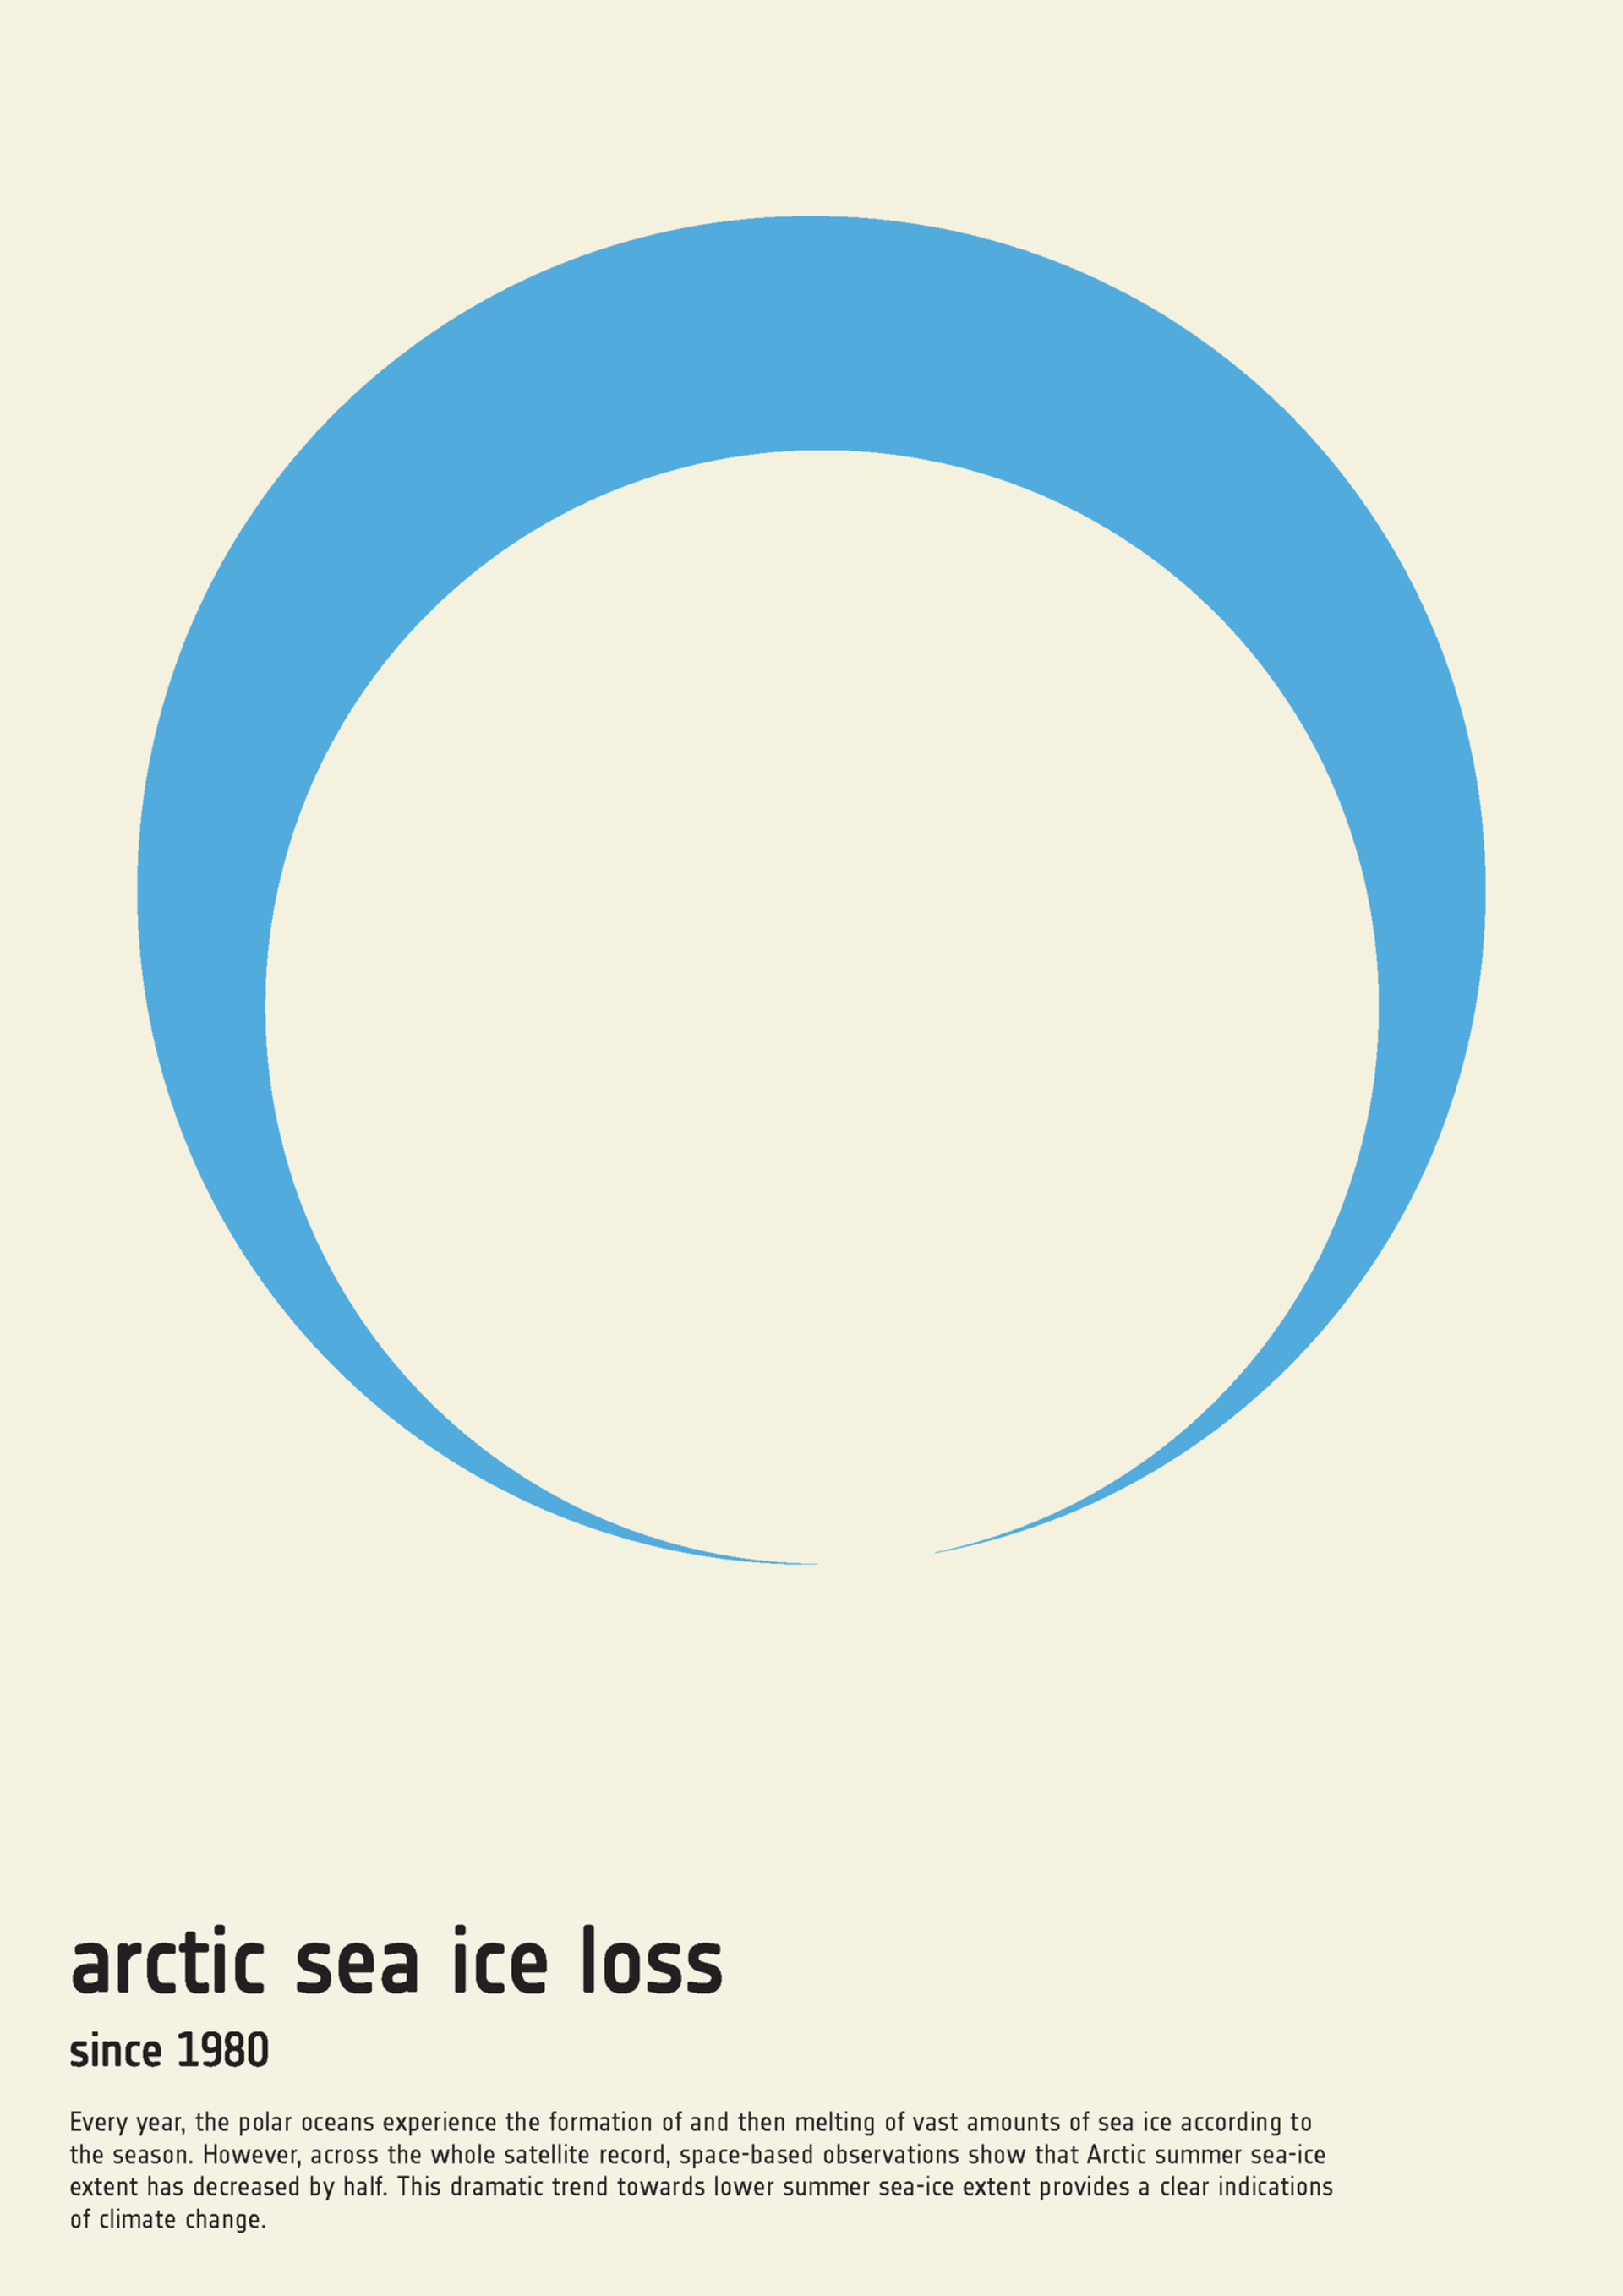
Other competition entries focussed on the long-term impacts of a warming world. For example, the long-term decline in Arctic sea ice extent, perhaps one of the most stark indicators of climate change, featured three times in the top 10 visualisations. These visuals were created using data from Eumetsat's Ocean and Sea Ice Satellite Application Facility.
Glacier ice loss, the pattern of burned area resulting from wildfires across Europe and alternative approaches to depict land cover changes made the shortlist – all of which were based on satellite observations.
The winning Little Picture and the 10 runners up can be viewed at ESA’s Little Picture gallery.


Create your own Little Picture
If you are inspired to create your own data-driven visualisation to raise awareness of the changing taking place across the climate or stimulate debate and climate action step-by-step tutorials and a best practice guide available from ESA and Eumetsat respectively to get you started.
To access climate data records visit the ESA Climate Change Initiative Open Data Portal, or Eumetsat and ECMWF’s data stores.
Little Pictures competition 2023: winner and top 10 runners up
| Little Pictures Title | Creator | |
| Winner | Urban and rainforest regions in Brazil | Sacha Berna |
| Runner up | Urbanization on the rise | Stefan Pullen |
| Runner up | Burned area in Europe | Anne-Lise Paris |
| Runner up | Global monthly temperature from 1940 to 2023 | Neil Kaye |
| Runner up | Arctic Sea Ice Decline. 2022 vs 1980 | Silvia Romanelli |
| Runner up | World land composition | Jan Everaert |
| Runner up | Arctic sea ice loss | Natan Verbeelen |
| Runner up | Arctic sea ice extent | James Williams |
| Runner up | Global lake area represented as a drop of water | Ted du Bois |
| Runner up | Atmospheric carbon dioxide over Europe 2014–2021 | Neil Richards |
| Runner up | Swiss glaciers reduction | Cinzia Bongino |