Most detailed global colour map of Jupiter ever produced
This colour map of Jupiter's southern hemisphere was produced from images taken by the NASA/ESA/ASI Cassini-Huygens spacecraft on 11/12 December 2000, during its fly-by of the giant planet on its way to Saturn.
This is one of the most detailed global colour maps of Jupiter ever produced; the smallest visible features are about 120 kilometres across.
This map and a corresponding one of the northern hemisphere (polar stereographic projections that show the north or south pole in the centre and the equator at the edge) are composed of 36 images. A pair of images covering Jupiter's northern and southern hemispheres was acquired in two colours every hour for nine hours as Jupiter rotated beneath the spacecraft.
Although the raw images are in just two colours, 750 nm (near-infrared) and 451 nm (blue), the map's colours are close to those the human eye would see.

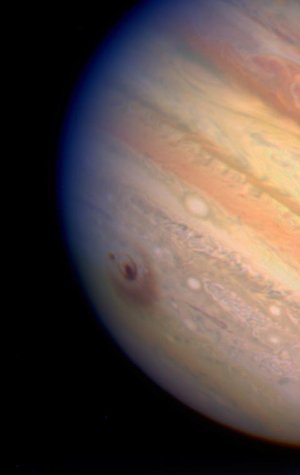
The maps show a variety of cloud features, including parallel reddish-brown and white bands, the Great Red Spot, multi-lobed chaotic regions, white ovals and many small vortices. Many clouds appear in streaks and waves due to continual stretching and folding by Jupiter's winds and turbulence.
The bluish-gray features along the north edge of the central bright band are equatorial 'hot spot' meteorological systems. Small bright spots within the orange band north of the equator (northern hemisphere) are lightning-bearing thunderstorms.
The polar regions shown here are less clearly visible because Cassini viewed them at an angle and through thicker atmospheric haze.
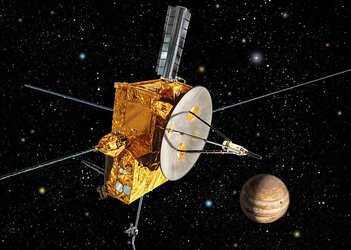
The Cassini-Huygens mission is a co-operative project between NASA, ESA and ASI, the Italian space agency.


