
ESA’s Star Mapper visualisation
Click to launch the ESA Star Mapper visualisation
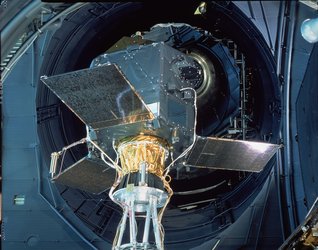
In 1989, ESA launched the first space mission dedicated to astrometry – the science of charting the sky. The satellite was named Hipparcos, echoing the name of ancient Greek astronomer, Hipparchus, who compiled the oldest known stellar catalogue in the second century BC.
Hipparcos operated for over three years and a catalogue based on its data, released in 1997, had a major impact on many areas of astronomy research.
This catalogue listed 117 955 stars, reporting their positions with unprecedented accuracy, alongside estimates of their distance from us and motions through the Galaxy. It was a huge advance on the best catalogues compiled from ground-based observations, which contained information for just over 8000 stars.
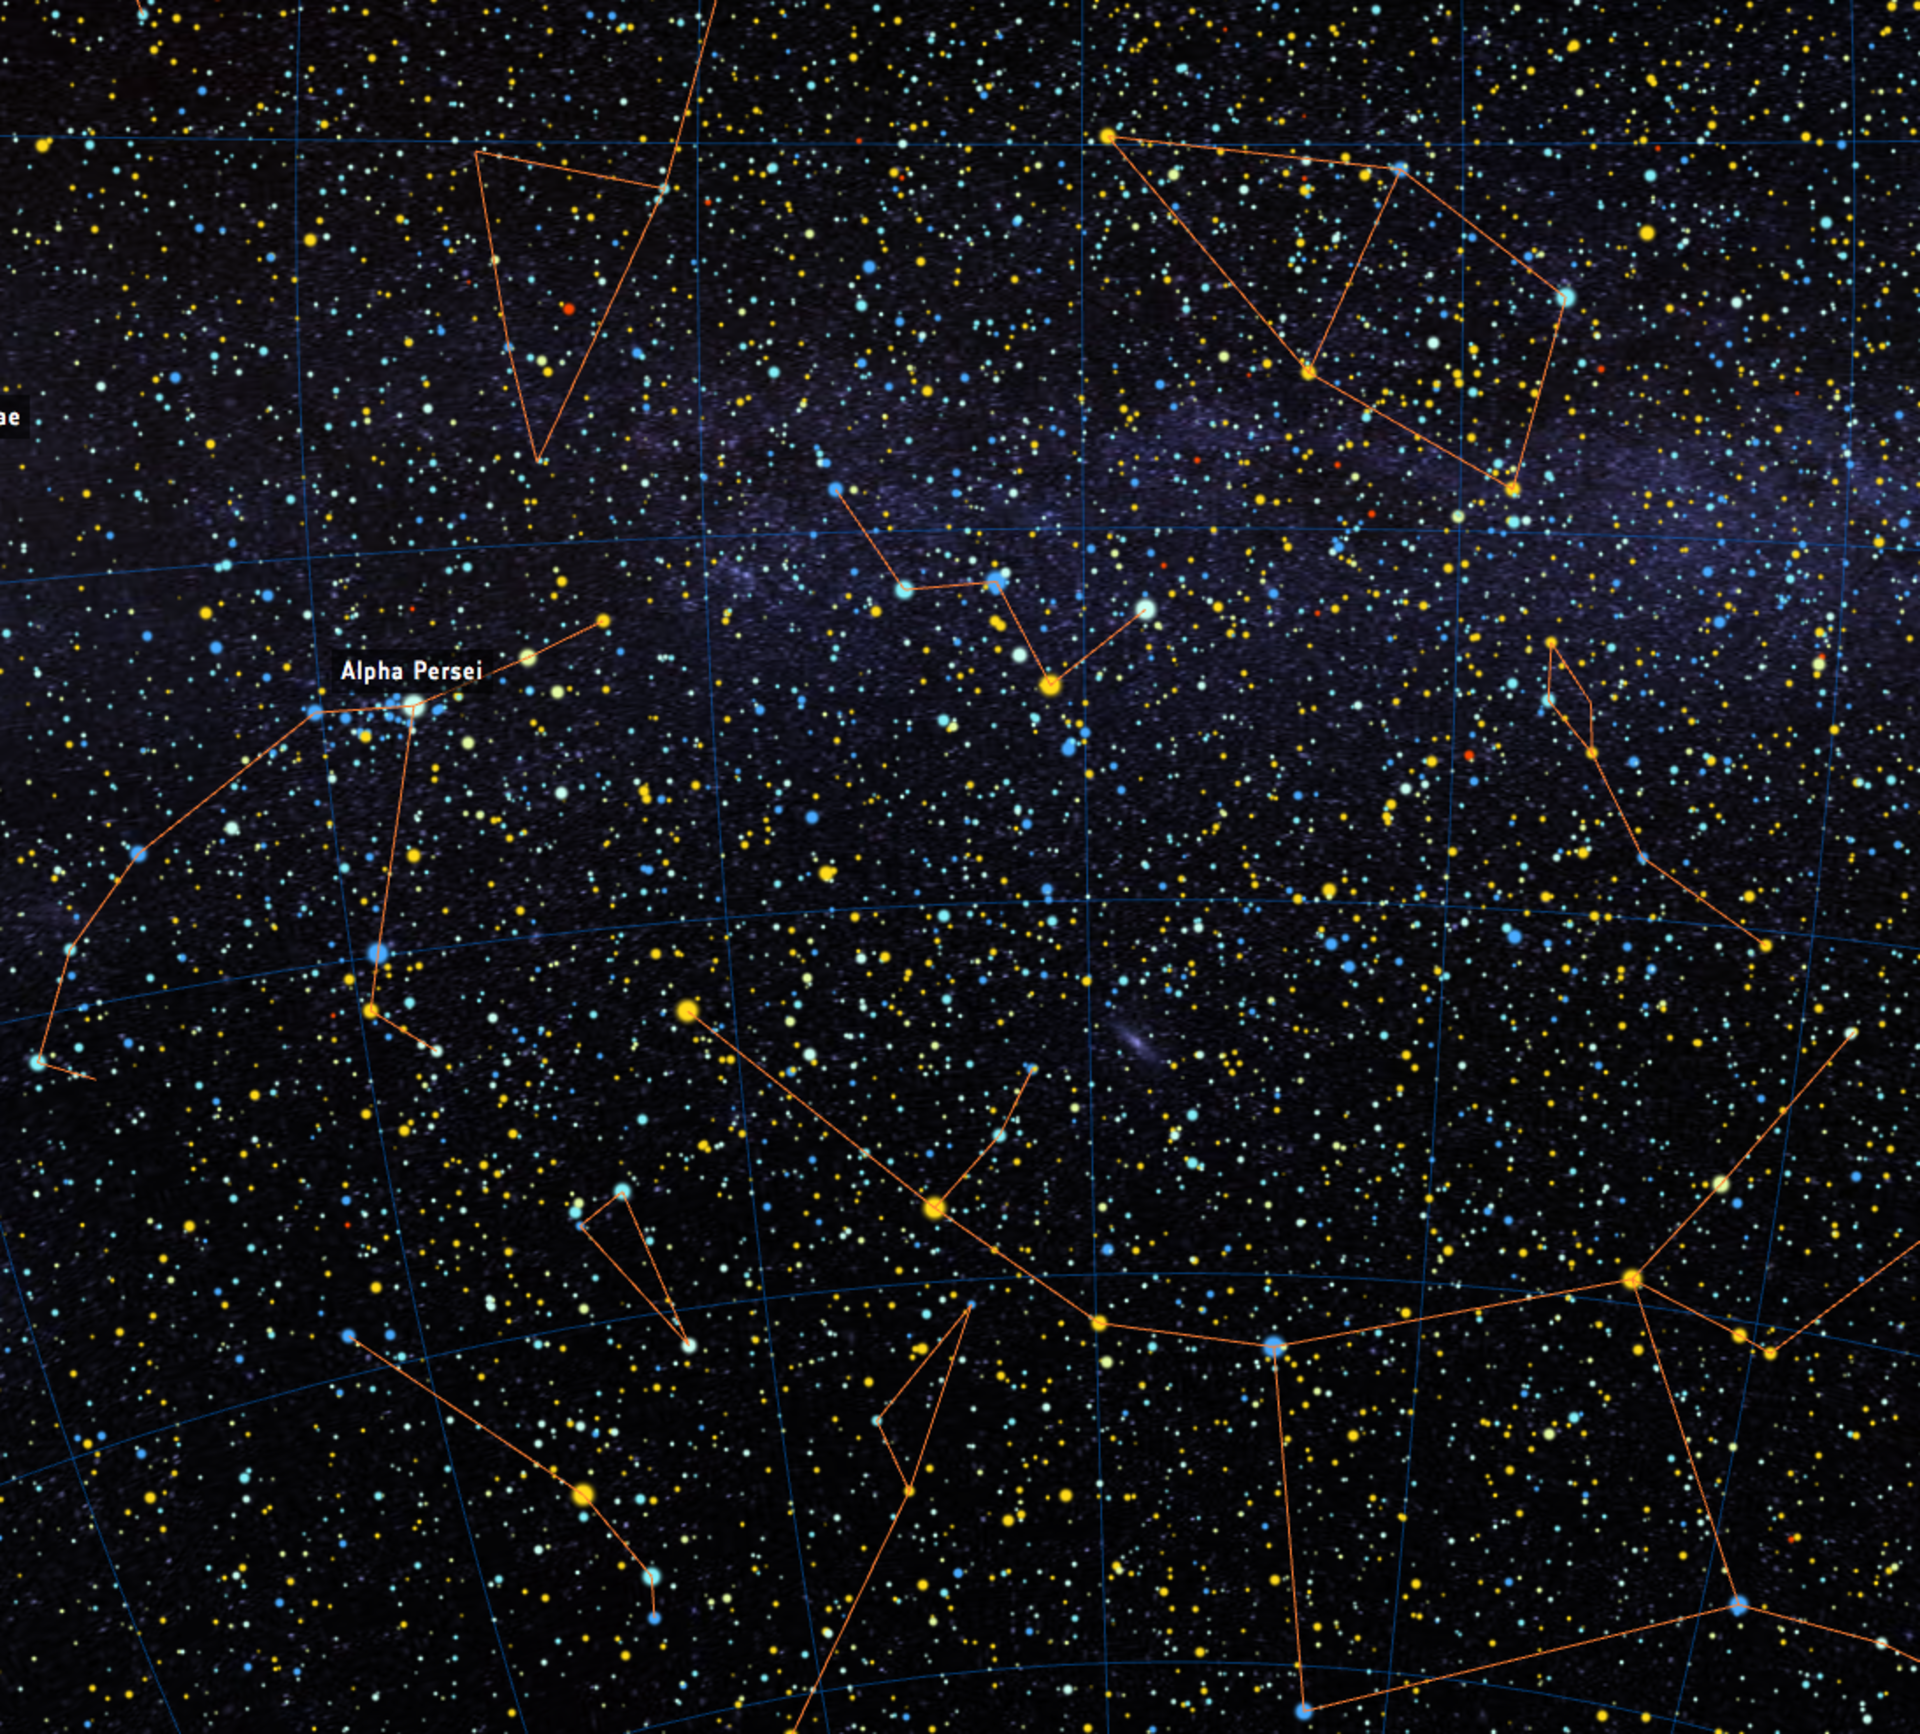
The ESA Star Mapper visualisation is an exploration of some central aspects of astrometric star catalogues, using data from ESA’s Hipparcos mission.
This interactive experience allows users to delve into this famous dataset, exploring the three-dimensional distribution of almost 60 000 stars from the Hipparcos Catalogue. Stars are visualised as a function of their brightness; it is also possible to show their colours, as well as names and parent constellations for the brightest stars.
Users can get a sense of where in the sky stars were located in the past – or will be in the future – based on their motions measured by Hipparcos.
A visualisation of the ‘Hertzsprung-Russell diagram’, a tool used by astronomers to study the evolution of stars, is provided as well.
The next great breakthrough in this field will come with ESA’s Gaia mission, launched in 2013. Gaia will make a census of more than a billion stars – roughly 1% of the content of our Galaxy – of such superb precision and detail that it will revolutionise astronomy again.
The journey starts at: http://sci.esa.int/star_mapper/
More about Hipparcos: http://sci.esa.int/hipparcos/


