Impact of space activities in French Guiana
The benefits of ESA activities go beyond the borders of European continent, not only because satellite-based capabilities offer services at a global level, but also because the main ESA launch site is based in French Guiana. The Agency has investigated the impact stemming from presence of the Centre Spatial Guyanais (CSG, or Guiana Space Centre) on the South-American state.
The applied methodology for estimating the economic impact of CSG on Guiana enabled to:
- gather information about the scale of spending by the Centre on labour and suppliers;
- gather information about the share of spending on suppliers that goes to local suppliers;
- use input-output (I-O) methods to estimate the subsequent impacts on suppliers, the induced effects on household spending and their suppliers, and the leakages to saving and imports.
The impacts of CSG encompass purchases on suppliers, the induced effects on household spending and their suppliers, and the leakages to taxes, saving and imports.

We estimate that over 2000-12 CSG own total (gross) output was almost € 14 B through maintenance and launch activities (see Table 1). The level of output varied from year to year depending on the number of launches, ranging from € 1.25-1.75 B in 2000, 2002 and 2012, when there were 12, 11 and 10 launches respectively, to just over € 0.6 B in 2004, when there were just 3 launches.
We assume that output of MCO (Maintenance of Operational Conditions) activities is fairly stable regardless of the number of launches and estimate that it was around € 40 M in any year. This means it accounted for 45% of gross output over 2000-12, with launch activities accounting for the rest.
In delivering these services and outputs, we estimate that CSG bought in around € 13 B of goods and services inputs over 2000-12. Approximately two-fifths were bought in to support MCO activities with the remainder being used to support launch activities.
From the available data, imported inputs for MCO activities are around just 7.5% of inputs for MCO activities inputs were imported in 2003. If we assume this to be constant between years, this would suggest that of around € 5.4 B of inputs purchased for MCO activities, around € 0.4 B were imported.
Around € 7.6 B of inputs were purchased for launch activities over 2000-12 and we calculate that € 6.3 B of these were imported and just € 1.3 B were sourced locally.
By our calculations, the value added generated by MCO activities is stable at € 60-80 M per year; the value added generated by launch activities is generally small and fluctuates in line with the number of launches in each year. Taken together, we estimate that CSG generates € 70-90 M in value added in most years, with one or two exceptions.
As a result of this, we calculate that CSG generated around € 1 B of value added over 2000-12. We estimate that around half of this was accounted for by profits. Most of the remainder was accounted for by wages and salaries and employers social security contributions. Around € 42 M was generated in production tax revenues.

Employment at the CSG base has grown by 26% between 2005 and 2013 (see Table 2). The general trend has been a gradual rise over time (up to 1,685 in 2013) with little impact from the global downturn. This is interesting because employment in the broad transport sector did fall around the recession and has only grown modestly since. This meant that the proportion of transport employment accounted for by the space sector grew from just over 50% in 2005 up to nearly 76% in 2011. Over 2005-12, around 68-74% of space sector workers were permanently stationed at the base; this group is likely dominated by workers engaging in MCO activities.
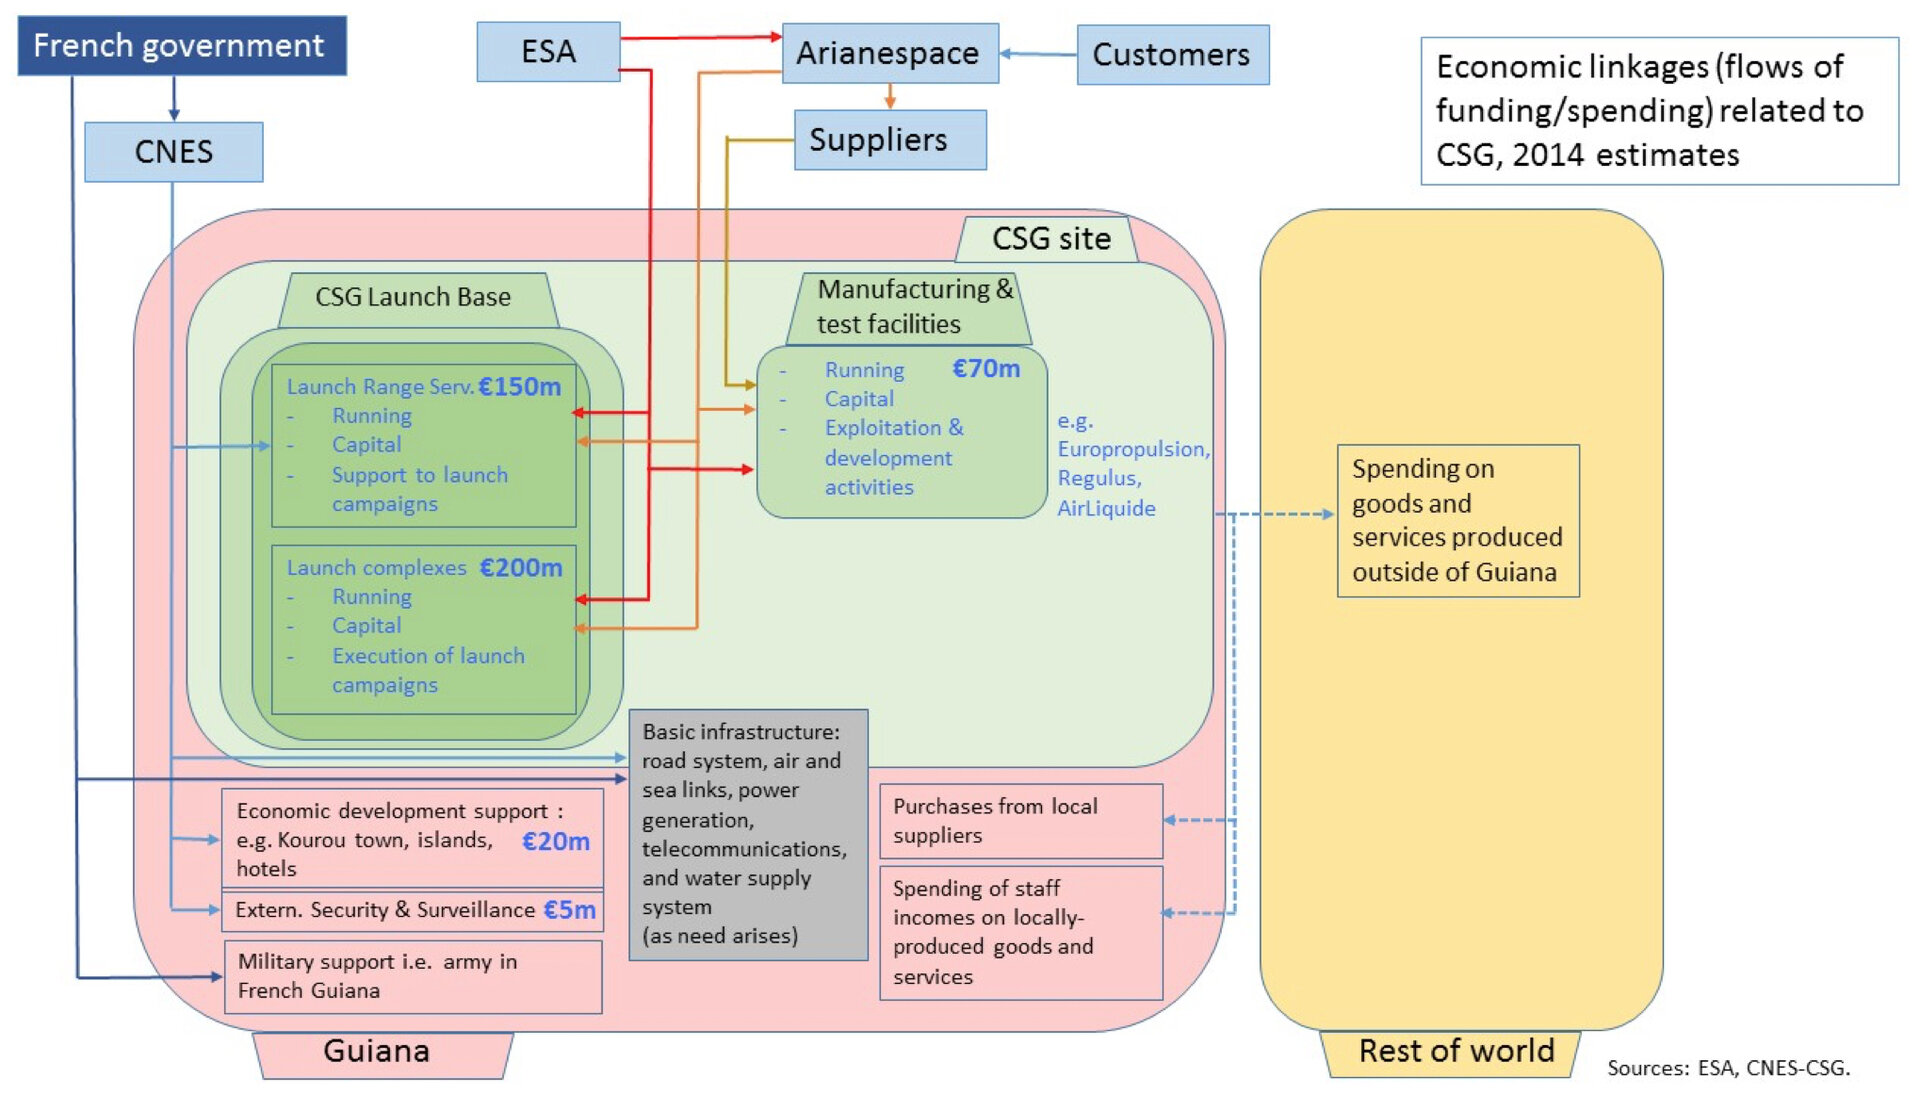
Around € 150 M of expenditure (funded by CNES, ESA and Arianespace) went towards service activities such as maintenance for the whole CSG base, while 200 M of expenditure (funded by ESA and Arianespace) went towards the launch complexes, which includes the execution of launch campaigns. In 2014, ESA, Arianespace and other external firms in Guiana spent 70 M in manufacturing and testing activities that occur within the confines of the base. As well as contributing to basic infrastructure, CNES spent € 20 M to assist the development of the local economy and € 5 M on external security.
In order to assess the wider impact of CSG on Guiana, we considered as key parameters the value added, the employment level and tax income.

We present in Table 3 the estimates of the impact of CSG on value added in Guiana.
Value added generated by CSG directly contributed to 2.9% of GDP over 2000-12. This figure rises to 17.7% when accounting for indirect and induced impacts on the wider economy, which contributed to 14.8% of GDP in the same period of time.

Table 4 presents the estimates of the impact of CSG on employment in Guiana.
The estimated direct number employed is an average of 1,384 per year over 2000-12. The impact of CSG on total employment in Guiana was around 13% when including indirect and induced effects.
Another aspect that has to be stressed is the revenues stemming from taxation. Activity in the space sector is subject to the following features of the tax regime:
- as a public research institute, CNES is exempt from business tax (taxe professionnelle), but it is subject to other taxes (property taxes, import duties, taxes on wages);
- the import of launchers and satellites is not subject to import duty;
Arianespace’s activity in Guiana does not generate sufficient profit to make any significant contribution to business tax.

Table 5 shows that the impact of CSG contributed to around 46% of import duty revenues over 2000-07. This compares with INSEE 2008 estimates showing that in 2002 CSG the total impact of activity accounted for some 40% of the total import duties. INSEE 2008 also suggests that the CSG impact accounted for 25% of Guiana’s taxes on companies and wages (a narrower category, than ‘taxes on income and wealth’ shown in Table 5, and so the share of the Guiana total for the wider category is lower than INSEE’s figure). We estimate that 37% of revenues from other taxes on products can be attributed to the direct, indirect and induced impacts of CSG. Much of this revenue arises from spending on energy products (including direct, indirect and induced impacts). When accounting for indirect and induces impacts, CSG activity contributed 30.1% of total revenues raised in Guiana.
A gross output multiplier coefficient shows the impact of increasing expenditure in a particular sector by one euro on the gross output of other sectors in the economy. Type I multipliers show the impact on the sectors that supply the space sector. These multipliers also capture the knock-on impact upstream of the firms directly supplying the space sector. Type II multipliers for the space sector capture the Type I effect but also account for an increasing demand for workers as firms look to increase output. This leads to an increase in wages and salaries which the workers then spend on good and services (the induced effect). Table 6 also displays a breakdown of the multiplier coefficients to show the impact of an increase in MCO activities and launches expenditure on specific sectors in the Guianese economy.

A one euro increase in MCO activities expenditure generates € 2.14 (Type I multiplier) of output across all of the sectors in the Guianese economy. This rises to € 2.75 (Type II multiplier) if taking into account the impact of workers spending wages and salaries on goods/services.
Similarly, a one euro increase in launches (domestic) expenditure yields € 2.18 in output across the economy, rising to € 2.70 when taking into account the induced effect. Interestingly, the difference between the Type I and Type II multipliers appears to be driven by one sector: real estate activities. One euro spent on MCO activities or launches generates € 0.28 (€ 0.26 of which is induced) and € 0.23 (€ 0.21 of which is induced) of domestic real estate output respectively.
The sectorial breakdown of the Type II multipliers will be focused on for the remainder of this article.
The knock-on impact generated by the MCO activities of the base are relatively low for intermediate goods (0.05), capital goods (0.06) and energy (0.06) partly because of the high import content of these purchases in Guiana and also due to MCO activities purchases being focused more on services. However, purchases relating to launch activity are dominated by intermediate goods and capital goods. We estimate that capital and intermediate goods accounted for around 95% of purchases related to launch activity and over half of all purchases by the space sector in 2007. The base still acquires most of these goods by importing (we estimate that over 83% of these purchases were imported) but there are positive impacts on domestic producers. A one euro increase in spending on launch activity generates € 0.41 in domestic capital goods output and € 0.30 in domestic intermediate goods output.
Around 40% of intermediate consumption by the space sector is allocated to spending on business services: demand for business services largely comes from the MCO activities of the base (around 96% of space sector demand comes from MCO activities). A one euro increase in expenditure on MCO activities generates € 0.75 in domestic business services output. Spending on MCO activities typically remains stable and does not fluctuate as the number of launches change from year to year. There is still some positive impact from launch activity as a one euro increase in expenditure is associated with a € 0.19 increase in business services output.
Demand for other services by the space sector is relatively modest; hence, relatively small knock-on impacts to these sectors. The coefficient for hotels and restaurants is slightly higher for launch activity that for MCO activities. A one euro increase in spending on launches generated € 0.03 in output for hotels and restaurants. This perhaps reflects a weak boost to hotels and restaurants from tourism stimulated by launch activity.
One euro increase in spending on MCO activities leads to a € 0.27 increase in wages and salaries in Guiana as more workers are employed as a result of rising demand for labour from the space sector and the upstream suppliers. Similarly, a one euro increase in expenditure on launch activity generates € 0.23 in additional wages and salaries.
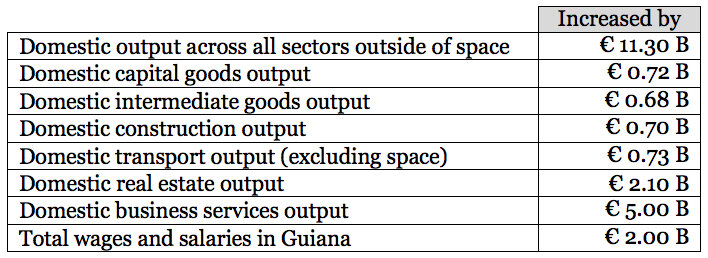
Over 2000-2012, we estimate that output of MCO activities was € 6.3 B and output for launches (domestic) was € 1.28 B (launches -imports- output was € 6.34 B). Based on the Type II multiplier analysis, the estimated impact of this expenditure on the economy of Guiana is as shown in Table 7.