
Science & Exploration
Omega_SouthPole
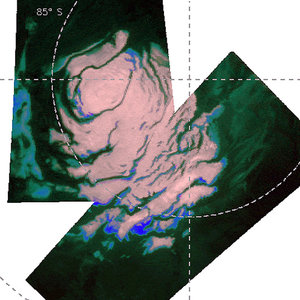
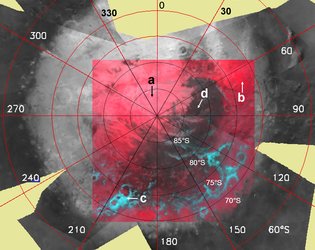
Correlated variations of the CO2 ice, H2O ice and albedo. a, Map of the CO2 ice, from deep blue (higher concentration) to red (ice-free), matching the bright cap, centred around 878 (latitude) and 08 (longitude). b, Same area mapped for its H2O-ice content. c, Same area, seen in its near infrared I /F (intensity divided by solar flux), from dark (blue to green) to bright (red). Local I /F variations within the cap are clearly correlated to the H2O/CO2 ratio: the bluest water-ice areas are highly depleted in CO2, and darker, while the brighter areas are those where H2O is depleted in favour of CO2.


