
Applications
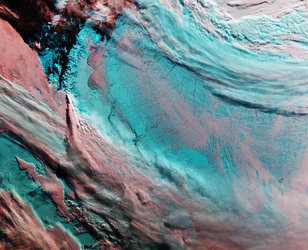
ERS-2/Envisat InSAR: Larsen Ice Shelf
An interferometric image of the Larsen Ice Shelf generated from data acquired on 26 February 2010 by ESA's Envisat and ERS-2 satellites, during their last tandem mission. In the image, the brightness of the pixels depends on the reflectivity of the terrain to the radar, while the colour variation relates to the velocity of motion of the sea ice/icebergs and to its direction. Denser fringes (colour variations) represent faster displacements. One full colour cycle (e.g. from red to red) corresponds to around 1.4 cm/hour of additional displacement.


