
Agency
Best view yet of global gravity
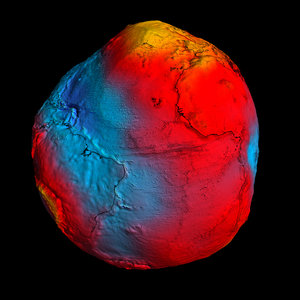
Having collected 12-months of gravity data, ESA's GOCE mission has delivered the most accurate model of the 'geoid' ever produced, which will be used to further our understanding of how Earth works.
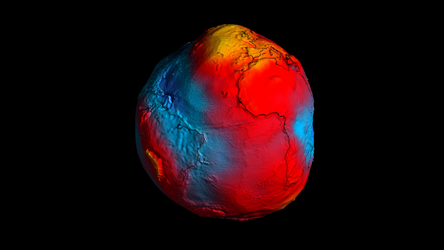
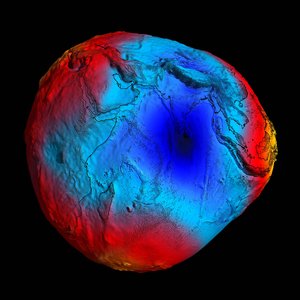
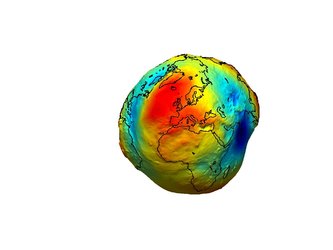
The colours in the image represent deviations in height (–100 m to +100 m) from an ideal geoid. The blue colours represent low values and the reds/yellows represent high values.
The geoid is the surface of an ideal global ocean in the absence of tides and currents, shaped only by gravity. It is a crucial reference for measuring ocean circulation, sea-level change and ice dynamics – all affected by climate change.


