
Applications
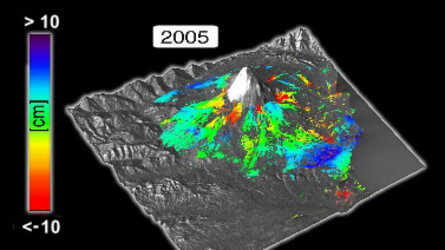
ERS captures Etna 'breathing' 1992–2001
Data from the ERS synthetic aperture radar acquired between 1992 and 2001 were used in this animation of Mt. Etna in Sicily, Italy. It is made up of over 100 interferograms, which are produced by analysing the phase difference between consecutive radar images. The animation plots the surface deformation projected in three dimensions and superimposed on a digital elevation model of the volcano. Initially, Etna deflates at the end of a two-year-long series of eruptions from the volcano's flanks. It begins to inflate again through 1995 and then continues with a series of inflation and deflation episodes – a 'breathing' process that reflects activity at the summit.


