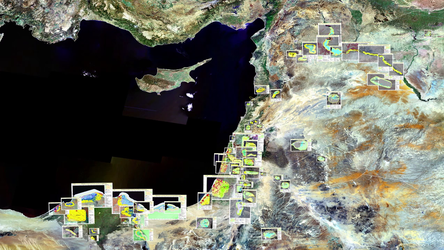

Wetland monitoring in Egypt
Land use and land cover maps from 1973 (top), 1990 (middle) and 2005 (bottom) of Lake Burullus in Egypt. The maps were created from Landsat data using the GlobWetland II observing system toolbox. Changes include a sharp increase of aquaculture (in cerulean blue) between 1973 and 1990 (fishponds), followed by a decrease of fishponds indicated from 1990 onwards at the west part of the main lake. An increase in urban settlements (in red) and an overall decrease of salt marsh vegetation (in violet) in the lake itself are evident. This is an indication of eutrophication due to the increase of waste water into the lake (released by the large aquaculture area). Changes also include the extrapolation of road network and drainage channels in the direct vicinity of the lake.


