
Enabling & Support
Debris object evolution
05/04/2017
3656 views
7 likes
290134 ID
Thank you for liking
You have already liked this page, you can only like it once!
COOKIES
To enable the sharing functionality, please accept all cookies. To adjust your cookie settings, click here.
Chart showing the evolution of the tracked and published space object population and its composition by object class.
The horizontal axis corresponds to year, and runs through to 2017. The vertical axis corresponds to number of objects, including all categories of debris objects (yellow to green) as well as intact satellites (red).
The latest updated version of this chart can be accessed in the ESA Space Debris User Portal.
-
CREDIT
ESA -
LICENCE
CC BY-SA 3.0 IGO or ESA Standard Licence
(content can be used under either licence)

Don Kessler
Image
5496 views
48 likes

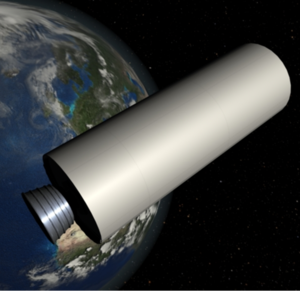
Spent upper stages
Image
3363 views
9 likes

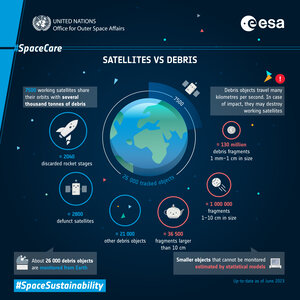
Satellites vs Debris
Image
10038 views
86 likes

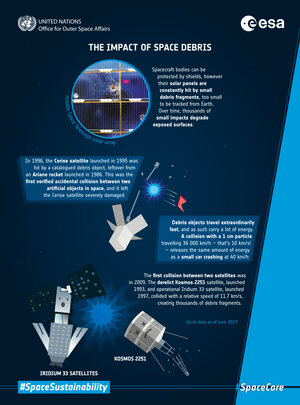
The impact of space debris
Image
6784 views
117 likes

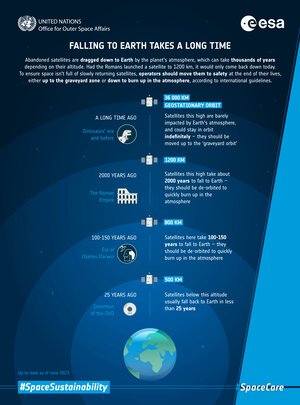
Falling to Earth takes a long time
Image
18721 views
199 likes
