

Possible water ice at Mars’s equator
Close to Mars’s equator lies the Medusae Fossae Formation (MFF), a fascinating series of wind-sculpted deposits that may be the biggest single source of dust on Mars.
When Mars Express turned its MARSIS radar sounder instrument towards the MFF, it revealed a surprise. The radar signals that echoed back from below the surface match what we’d expect to see from layered deposits rich in water ice.
In this image, the white line on Mars’s surface (top) shows a stretch of land that was scanned by MARSIS. The graph below shows the shape of the land and the structure of the subsurface, with the layer of dry sediments (likely dust or volcanic ash) in brown and the layer of suspected ice-rich deposits in blue. The graph shows that the ice deposit is thousands of metres high and hundreds of kilometres wide.
If all the suspected water ice in the MFF melted, it would cover Mars in an ocean of water up to 2.7 m deep.
[Image description: At the top is an image of Mars's surface. A white line crosses the surface diagonally, with a black arrow coming down from the white line to point at a graph below. The graph shows the shape of the surface and subsurface. It indicates that under the surface is a thin layer of dry sediments then a thick layer of ice deposit. The x axis of the graph shows distance, indicating that the diagonal white line covers a distance of 1000 km. The y axis of the graph shows elevation, indicating that the ice deposit is up to 3000 m thick.]

Mars Express radar data indicating heaps of water ic…
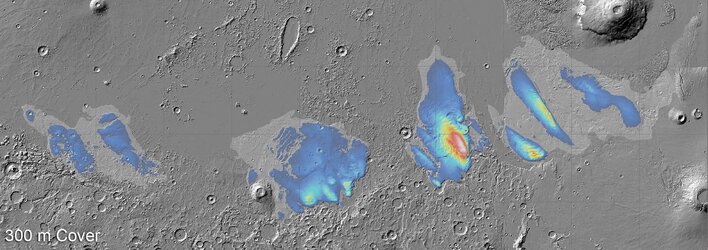
Map of suspected ice at Mars’s equator

Map of suspected ice at Mars’s equator

Location of Mars’s Medusae Fossae Formation
