Applications
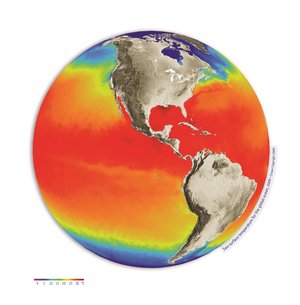
Global sea-surface temperature 1991–2010
An animation showing changes in global sea-surface temperature between 1991 and 2010, developed through ESA’s Climate Change Initiative. The animation is based on data from ESA’s ERS and Envisat Along Track Scanning Radiometers, and the Advanced Very High Resolution Radiometers carried on the National Oceanic and Atmospheric Administration's Polar Orbiting Environmental Satellites and Eumetsat’s MetOp satellites.


