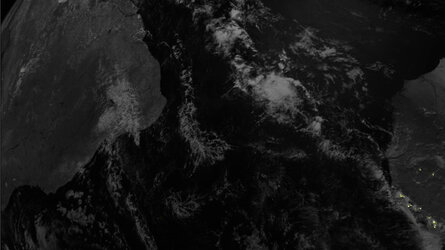
South America
MTG-I1’s Lightning Imager makes detections far from the centre of the field of view of the camera, right up to near the horizon in South America. The elongated oval shape of flashes/storms close to the edge is the effect of the Lightning Imager’s large viewing angle in that part of its field of view.
The daily cycle of lightning is clearly shown, with fewer storms during the morning hours when the daylight has just arrived and the most lightning activity during the late afternoon and early evening hours, around sunset.
The animation also shows that much more lightning occurs in the northern part of South America (top left in the video) compared to the areas further south (bottom left in the video).
This is the effect of Northern Hemisphere late spring/summer when the main trigger of tropical thunderstorms, the Intertropical Convergence Zone (ITCZ) moves to the north of equator.
This animation, zooming in on South America, was made using five days’ worth of data from the Meteosat Third Generation Lightning Imager’s west camera, from 00:00 UTC 7 June to 23:59 UTC 11 June 2023. It was made from raw preliminary data and is not for operational use.


