
|
Übung 3: Lavaerkennung: Bilder der Krise und Karten 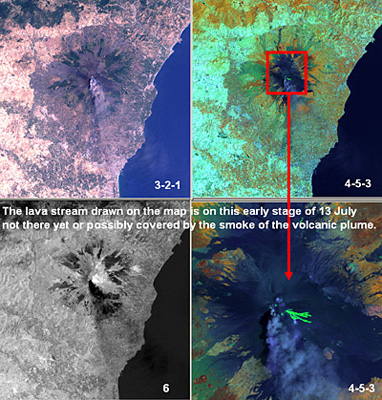 The FCC containing mid-IR (band 4-5-3) of the Landsat images of 13 July 2001 enable us to distinguish lava ages. Hot lava becomes clearly visible and pops up as bright green, although the plume is not significantly visible. The true colour image (3-2-1) shows a giant plume, and the lava looks quite homogeneous. The thermal image (band 6) clearly shows the hot surface temperature of the whole area surrounding the lava, as well as a hot area in the north of the volcano. The plume is clearly visible as a much cooler object. The vegetated areas on Etna have significantly lower values (darker) then the lava-covered areas.  Lava map of Etna's July-August 2001 eruption showing lava flows, fissures, and related features. In light pink, the 1983 lava flow field is displayed for comparison. The legend is also linked to numbers near the vents and fissures, as a way to indicate the sequence of activity. The sketch map is preliminary; it is a composite based on both fieldwork by Behnke and others, and already available maps appearing on the web, including those on the site of INGV-Sezione di Catania. |