
Exercise 2

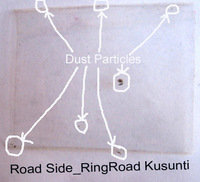 | |
Fig. 8: Roadside Ringroad Kusunti
| |
Air Pollution of the Kathmandu Valley Case Study Worksheet excercise 2. This exercise does not require the use of LEOWorks.
Visual assessment of the pollution level
Exercise 1 allows you to qualitatively judge air pollution. Is there a simple way to actually measure the degree of air pollution?
Such an assessment is possible by accumulating and then counting dust particles on an adhesive tape. But remember, these dust particles are much larger than P10.
Materials required
- Cardboard
- Large adhesive tape
- Scissors
|  | | |
Fig. 9: On moving vehicle
|
Preparation
- Take strips of large-size transparent adhesive tape.
- Stick them onto cardboard (A4 size) in such a way that the sticky/glue part of the tape is exposed. Cover the cardboard completely with adhesive tape, leaving just a frame of 3 cm to be used to fix the cardboard.
- Prepare two or more of these cardboards with the same adhesive surface.
|  | | |
Fig. 10: Roadside within ringroad Jawakhel Chowk
|
Experiment
- Area selection: Choose easily accessible places e.g. roadside, traffic area, residential area, etc.
- Time: Give it at least 8 hours measuring time (all cardboards simultaneously).
- Weather condition: Try to practice the method after rainy days and dry condition days in order to see the difference in pollution level. This will be seen by the amount of dust particles that remain stuck on the adhesive tape.
- Now stick one of these cardboards somewhere at each of the chosen sites. The cardboards should be placed on the respected chosen area from 9 am to 5 pm (more or less 8 hours). Place them horizontally above the ground. If possible, keep them out of children's reach and ensure they are well 'stuck' to the surface.
- Collect the cardboards the same evening.
- Prepare a table like the one shown below.
 |
Particle table
|
1. Analyse each cardboard visually by counting the number of small, medium, and large size dust particles, and fill in a table.
2. Compare the results on each cardboard.
3. Make it a class event! In a second campaign, you might choose more locations of high and low air pollution.
4. Construct an air pollution map of your city, by putting the location and its figures (e.g. total amount at each station) on a city map. Identify areas of very high, high, medium, low, and very low air pollution. Use colours from red (very high) to orange, yellow, light green, to green (very low).
Figures 8, 9, and 10 are some of the pictures of the practical exercises conducted in some areas of Kathmandu (cardboards were exposed the day after a rainy day).
Last update: 16 April 2013
| |
Kathmandu Valley
| | • | Introduction (http://www.esa.int/SPECIALS/Eduspace_Global_EN/SEMFLK0SAKF_0.html) | | | • | Air Pollution (http://www.esa.int/SPECIALS/Eduspace_Global_EN/SEMBPK0SAKF_0.html) | | | • | Study area (http://www.esa.int/SPECIALS/Eduspace_Global_EN/SEMKSK0SAKF_0.html) | |
Exercises
| | • | Introduction (http://www.esa.int/SPECIALS/Eduspace_Global_EN/SEMM5L0SAKF_0_ov.html) | | | • | Exercise 1 (http://www.esa.int/SPECIALS/Eduspace_Global_EN/SEM9BL0SAKF_0.html) | | | • | Exercise 3 (http://www.esa.int/SPECIALS/Eduspace_Global_EN/SEMIRL0SAKF_0.html) | |
Links
| | • | Useful links (http://www.esa.int/SPECIALS/Eduspace_Global_EN/SEMO8M0SAKF_0.html) | |
Eduspace - Software
| | • | LEOWorks 3 (http://esamultimedia.esa.int/multimedia/LEOWorks3.exe) | | | • | ArcExplorer (http://esamultimedia.esa.int/multimedia/eduspace/ae2setup.zip) | |
Eduspace - Download
| | • | Fig. 7.1 - 7.10 (zip file) (http://esamultimedia.esa.int/docs/eduspace/Fig7_1-10.zip) | | | • | MERIS images of Kathmandu valley (zip file) (http://esamultimedia.esa.int/docs/eduspace/Kathmandu_airpollution_Ex-3.zip) | |
|
