|
Lagos - Exercises using Landsat data - continued
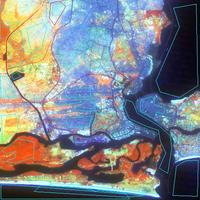
Maximum Likelihood In exercise 2 you have separated objects and elements of Lagos´ surface into classes. To interpret the features of a satellite image a visualised classification is very useful. The classified image is, with some basic revisions, similar to a thematic map. The main classes of Lagos´ surface are dense forest, densely built up areas, moderately built up areas, residential areas with gardens and industrial areas, natural cover (green space), beach, water. The maximum likelihood classification is a supervised classification method. It uses training fields. These fields are references for certain features. For each type of land cover to be classified at least one training field has to be defined. The program compares all these sample references and attributes each image element (pixel) to one of the given types of land cover classes. Open the program LEOWorks. If you have not downloaded the images of Lagos yet, go to the right navigation bar and click on the link. Choose File>Open. A dialog box will pop up. Choose the folder Lagos and select the first image Lagos_Landsat_Band_3.tif. Open Lagos_Landsat_Band_4.tif, Lagos_Landsat_Band_5.tif and also lagos_landsat_453.tif. Select (activate) image lagos_landsat_453.tif.
Choose Multivariate Analysis>Supervised Classification>Select Training Fields.
Note: The more training fields you are able to select for a class, the more accurate is the result.
Start with water surfaces and draw a polygon inside a water body. Name the class Water. Find another part to draw a second polygon inside a water body and name the class Water, too, and so on.
When you are done with the water, draw a polygon inside an area covered by dense forest and name the class Dense Forest. Do the same with all 7 pre-selected main classes.
Choose Multivariate Analysis>Supervised Classification>Maximum Likelihood and select the images Lagos_Landsat_Band_3.tif, Lagos_Landsat_Band_4.tif and Lagos_Landsat_Band_5.tif.
Set the Threshold Value to 0%. A new classified image opens. It contains seven colours reflecting the seven classes.
Choose Edit LookUp Table and select the water-class colour. Change the colour to a dark blue. Change all the other colours, too.
Save the image as lagos_classified.tif into your folder Lagos and compare it with the image lagos_landsat_453.tif.
Are the classified structures identifiable in the false-colour image? Which discrepancies emerge on accurate examination? Measurement A huge challenge for tropical cities like Jakarta, Manaus, Nairobi and Lagos is the enormous stream of immigration. Lagos´ population grows day after day. The growth in the decade from 2000 to 2010 is estimated to be 7 million people. In addition to the issue of preparing construction space for buildings, the necessary development of a city infrastructure is an enormous challenge for every government, and it is associated with huge costs.
Why do people in general migrate from rural districts into cities?
Which specific reasons may the Nigerian migrants have? Try to identify the general requirements for a working infrastructure of a mega-city. Which problems could appear in the sectors of freshwater supply, public transportation, canalisation, health care and education, if the population grows as fast as in Lagos?
It could be assumed that the millions of inhabitants live in loose structures considering the huge area of Lagos. The next exercise will clarify that question. Open the program LEOWorks. If you have not downloaded the images of Lagos yet, go to the right navigation bar and click on the link. Choose File>Open. A dialogue box will pop up. Choose the folder Lagos and select the image Lagos_Landsat_Band_321_120m.tif.
Choose Image>Measure tool and select Units>Metres. You do not have to enter the pixel size. That is not necessary because of the GeoTIFF format used for the data.
Draw a polygon around the sealed city surface, which appears in bright colours in the image. Start at the southern side by clicking the right mouse button. Draw the polygon along the city limits and close it by using the left mouse button.
All information is shown in the dialogue box, the distances of every single vector, the length of the polygon segments and the surface area. Convert the m² into km². Now calculate the population density by using the measured area of Lagos and the estimated population in the year 2000 (13 million). Note: The calculated density of population is related to the built-up area of Lagos and not to the administrative city border, which encloses an expanded area. Compare the density of population with the ones of e.g. London (1 580 km², 7.7 million inhabitants), Paris (1 200 km², 2.1 million inhabitants) and Berlin (839 km², 3.5 million inhabitants) and your own home town.
Which conclusions can be drawn from this comparison?
What does the average density mean to the city structure of Lagos? Try to answer this question by using the information on the 3 mega-cities London, Paris and Berlin and your home town and the population of Lagos (the quarters of Lagos with the highest population density reach 200 000 inhabitants per km²). Last update: 16 April 2013
| ||||||||||||||||||||||||||||||||||||||||||||||||||||||||||||||