Manual exercises - Continued
|  | Thermal infrared image | |
Thermal Variations
There are different types of deserts, e.g. sandy deserts, rocky deserts or icy deserts. The huge African deserts are predominantly sandy and rocky deserts. A characteristic of these deserts is a high temperature during the day and a low one at night. During the day the sand and rocks absorb the solar radiation.
But at night, without covering clouds, the discharge of thermal energy is high. The ground cools down. That is the reason even subtropical deserts can have sub-zero temperatures. See the animation of the Meteosat data over three days (infrared band) and describe the changes of the level of gray and therefore the temperature changes at the different times of day.
| | | Thermal infrared image |
Thermal infrared images measure the radiation from the surfaces of the Earth. Clouds can be seen very well. The surface of a cloud is cooler than the earth's surface. That is why clouds reflect less radiation. The infrared images are inverted so that clouds look white as in nature. This means that cold regions appear light-coloured, while warm ones appear dark.
Look at the two infrared images below. Both images were taken on the same day.
Describe and explain the different temperatures as shown in the two images. At what time of the day were the images taken?
Go to the Eumetsat homepage and follow the instructions to create an animation using a full day set of infrared images.
Describe the thermal changes during a day, focusing on deserts and water surfaces.

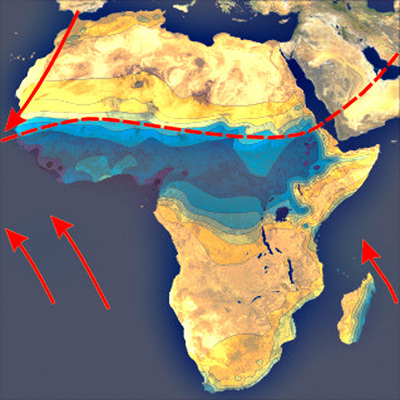
Precipitation and position of ITC in June

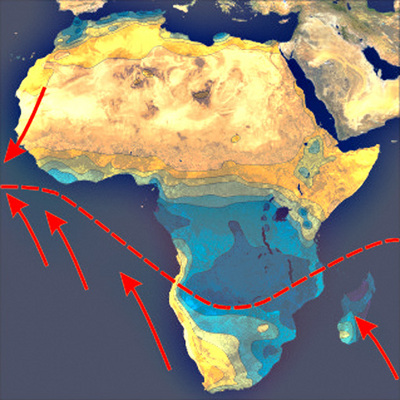
Precipitation and position of ITC in January
Weather today
How is the weather today, where is it raining, where is the sun shining in Africa? Where is the ITC located today?
To answer the questions go to the Eumetsat homepage and follow the instructions to create animations of the current weather situation in Africa.
Print a current Meteosat image of Africa and draw in the position of the ITC.
Compare the position of the ITC today with the precipitation maps shown above. Is the present position of the ITC as expected?
See the Legend for the 2 images.
|