|
Exercise 3: Eddies
As the current slows down, it becomes more vulnerable to deflection of its course, which is caused by the irregular shape of the seafloor (seafloor bathymetry), and projections along the coast. All of this creates large meanders in the currents.
In addition, fast flowing currents such as the Gulf Stream are very turbulent, with great differences in strength of flow within the current itself, as well as big boundary areas where water masses converge and diverge. In regions where there are great horizontal density differences, when the flow becomes very curvy, meanders end up separating from the main flow, forming high energetic eddies. Eddies are of great importance for many oceanic processes. They generate enormous sea level variations around them, transporting and redistributing salinity and heat between different water masses, and exchanging heat and water with the atmosphere. They can reach depths of more than 1500 metres, and their sea level differences cause upwelling (cold core eddies) or downwelling (warm core) flows. Consequently they play an important role in mixing different ocean layers, bringing nutrients from the deep waters to the surface and helping to fertilize the upper ocean.
Eddies can be detected from satellite infrared sensors, and are clearly visible in SST images. The images provided for the following exercise are Level 2 sea surface temperature products acquired by the Moderate Resolution Imaging Spectroradiometer (MODIS) instrument aboard the Aqua (EOS PM) satellite.
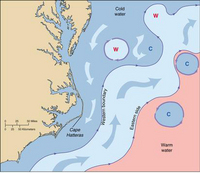
1. How many eddies can you spot in the image?
2. Using the Pixel Info View window, find the geographical coordinates of a future warm core eddy. Now locate a potential cold core eddy. Briefly describe how these warm and cold eddies are formed (remember the counter-flow between the warm Gulf Stream and the cold Labrador Current). Are they rotating clockwise or anticlockwise? The Pixel Info View window also displays the temperature values of the pixels in the image.
3. Place the cursor over the meandering Gulf Stream and read its temperature value in degrees Celsius. Move the cursor around the image and notice how the temperature changes. You may use Profile Plot to visualise the increase or decrease in temperature between the core and the edge of the eddies. You may also plot the profile from the Gulf Stream to the coldest point in the image. What is the difference in temperature? (Do not forget to zoom into the chart to visualise the temperature differences).
4. Now use Tools/Measure to measure the diameter of the eddies. What is the name used for eddies which are approximately this size? 5. Will the sea level of a warm core eddy be higher or lower compared to the sea level of its surrounding water? What is the reason for this difference? Why is it important for ocean fishery? Last update: 26 June 2013
| ||||||||||||||||||||||||||||||||||||||||||||||||||||||||||