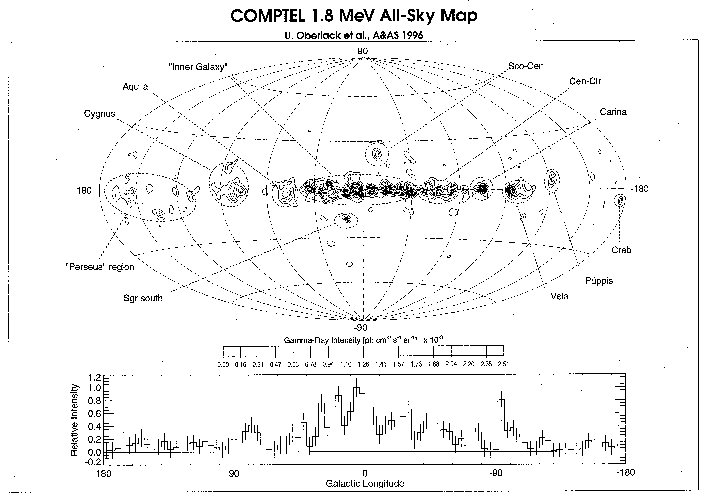
Figure 4.3.1.1/1: The COMPTEL 1.8 MeV all-sky map from 3.5 years of observation, with marked emission regions.

The Division s scientists involved in COMPTEL during the reporting period were K. Bennett, C. Winkler, S. Brandt, R. van Dijk, K. O'Flaherty, L. Hanlon, R. Much, F. Pelaez and O. Williams.
The Compton Gamma Ray Observatory (CGRO) was launched by NASA on 5 April 1991 carrying four experiment systems: BATSE, OSSE, EGRET and COMPTEL. COMPTEL is a Compton telescope operating in the energy range 0.75-30 MeV. It has a field of view of about 1 steradian. It weighs about 1.4 t and stands about 2 m high on the spacecraft. The Astrophysics Division is deeply involved in the COMPTEL telescope: in addition to the digital electronics unit and the onboard active calibration sources, the Division provided the ground station hardware and software used for experiment checkout until launch; it continues to be used for commanding the instrument and analysis of quick-look and realtime data at the University of New Hampshire. Preparations are being made for CGRO's second reboost, which will keep it at a stable altitude well into the next century. The satellite's current state of health and level of consumables indicate a possible lifetime of 15 years, though funding considerations by NASA may preclude such a long life.
The COMPTEL experiment was a collaborative development of the Astrophysics Division with MPE Garching (V. Schönfelder), University of New Hampshire (J. Ryan) and SRON Utrecht (W. Hermsen). For the Division, K. Bennett is a Co-PI and C. Winkler is a Co-I. There is a common data analysis facility running on heterogeneous systems in the four institutes. All four institutes have equal rights to the flight data, which takes several months to pipe-line process, and which remains propriety information for 1 year afterwards. NASA has established the GRO Science Support Centre in NASA Goddard, with the data, in both reduced and raw form, being deposited there.
The list of scientific goals of COMPTEL is extensive because it is the first imaging instrument to be flown in space covering this energy band. Within the collaboration, the routine analysis and detailed follow-up is shared between the groups. Co- authorship by scientists from the collaborating institutes is the general rule, and the lead author is assigned from within the science team for each study undertaken. A few subjects are addressed below that have particularly occupied Division scientists and resulted in scientific publication during the reporting period.
Gamma-ray lines
COMPTEL's energy range and spectral resolution is such that
it can provide unique and important results on nuclear gamma-ray
line astrophysics. In particular, the results obtained recently
include 26Al emission from the galactic plane,
44Ti emission from the supernova remnant (SNR) Cas A,
and MeV line emission from 12C and 16O
excited in the Orion molecular clouds.
COMPTEL's view of the sky in the light of the 1.8 MeV line from the radioactive decay of 26Al is shown in Fig. 4.3.1.1/1 (from Oberlack et al., 1996). It appears that the emission is clearly confined to the galactic plane. This spatial distribution is mainly a result of current nucleo-synthesis distributions, as massive stars, producing 26Al (half life 106 years) do not disperse significantly from the birth sites (i.e. molecular clouds in spiral arms) in 10 6 years. The region around Vela may provide the possibility of correlating the line emission with a single source. Most of the emission in the Cygnus regions can be explained by known sources (SNRs, Wolf-Rayet winds). Some features that fail to align with spiral arms apparently coincide with directions towards close associations of massive stars.
While it was the prime candidate line, the COMPTEL detection of 1.157 MeV gamma-rays from Cas A was unexpected, given the predicted yield of only a few 10-5 MSun of 44Ti synthesised during the SN explosion. Although the predicted flux was lower than that observed (4x10⁻⁵ph/cm2/s; Iyudin et al., 1994), the 6s measurement is from only a 2x10⁶s exposure and has a 25% systematic residual flux uncertainty. Additionally, conversion of this flux into an initial 44Ti yield is quite uncertain given the errors on 44Ti lifetime (~70 years), source distance (2.8-3 kpc) and date of the event (1668-1680), so there remains no conflict with the prediction.
Figure 4.3.1.1/1: The COMPTEL 1.8 MeV all-sky map from 3.5
years of observation, with marked emission regions.
X-ray binaries
X-ray binaries are systems containing a normal or evolved
star and a compact object, and can be very bright in X-rays, with
widely different temporal characteristics. In most X-ray
binaries, the compact object is a neutron star, but in some cases
it is believed to be a black hole of several solar masses. Little
is known about gamma-ray emission from X-ray binaries. COMPTEL
has observed all X-ray binaries more than once and has detected
two, both of which are black hole candidates: Nova Per 1992 and
Cyg X-1.
The transient Nova Per 1992 was detected only during the peak of its X-ray outburst in August 1992 (van Dijk et al., 1994). The 1-2 MeV flux is rather high compared to extrapolated models fitted to low energy gamma-ray data and suggests the need for an additional spectral component (Fig. 4.3.1.1/2).
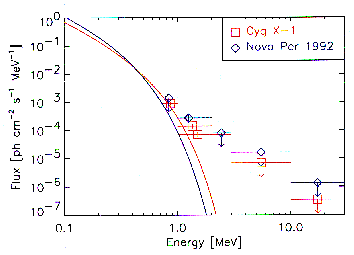
Figure 4.3.1.1/2: The COMPTEL fluxes for Cyg X-1 and Nova Per
1992 plotted together with extrapolated fits to low energy gamma-
ray data.
Cyg X-1 was detected in most of the observations when it was within the field of view. The flux values, or upper limits in the case of non-detections, do not show evidence for time variability of the MeV flux. An analysis of the combined data from the first 3 years of data indicates that an additional spectral component is needed (van Dijk, 1996; Fig. 4.3.1.1/2). The COMPTEL data thus provide the most significant evidence to date for the presence of a hot plasma in the inner accretion disc region.
Gamma-Ray Bursts
COMPTEL is able to localise and provide time-resolved spectra
of strong gamma-ray bursts (GRBs) occurring within its 1 sr field
of view. Five and a half years after launch, 31 bursts have been
localised, with an average total (statistical + systematic) error
<1.5° (see Fig. 4.3.1.1/3). Spectra have also been
measured for these bursts, providing a sample large enough to
investigate the spatial distribution and spectral characteristics
at MeV energies of the gamma-ray burst phenomenon. GRB spectra
have been found to be variable on time scales as short as any
detector resolution time. Studies of such variability are
important tests for GRB theories. An important aspect of spectral
variability is the spectral hard-to-soft evolution of the
spectral slope during the burst event (Hanlon et al., 1994).
Variability of continuum shapes and spectral breaks (i.e. shifts
of break energy as a function of time) has been observed in
COMPTEL data for GRB 910814. These processes have bearing on the
physical processes at the emission site.
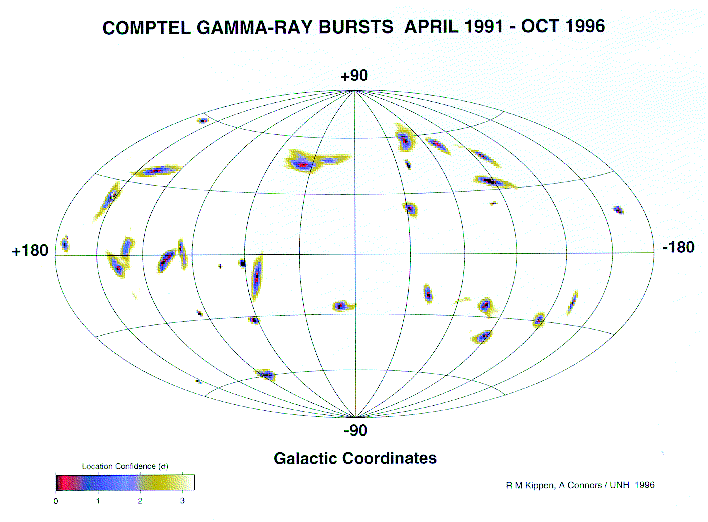
Figure 4.3.1.1/3: Statistical location uncertainty contours
(1,2,3 sigma confidence) of 31 bursts imaged by COMPTEL in 5.5
years of observation, plotted in Galactic coordinates.
COMPTEL telescope events (double-scatter events) provide time histories with 100 ms resolution and good signal-to-noise for stronger bursts that occur in the field of view (Ryan et al., 1994; Winkler et al., 1995). Analysis of fine temporal structure in combination with positive detection of high energy (>1 MeV) emission can be used to derive distance limits and to place realistic constraints on the nature of the burst process. Analysis of the GRB 940217 event, with variations on millisecond time scales, coupled with MeV emission, placed this event at a distance of between 145 AU (derived from imaging/ triangulation) and 11.7 kpc if isotropic emission of the MeV photons is assumed. Relativistic beaming (enhancing the burst efficiency in high energy photons) requires a Lorentz beaming factor on the order of >18 (assuming a distance of 1 Gpc, z=0.27). This, however, will result in a blue shift of the break energy to 9 MeV to avoid Comptonisation, which is not observed in the GRB 940217 data. The observed spectral break is thus not due to photon-photon interaction, but may be due to another process (e.g. single photon interaction with strong magnetic fields leading to pair creation), or GRB 940217 is closer than 1 Gpc. (Winkler et al., 1995).
The time-averaged spectra above 1 MeV of our 31 burst sample are all consistent with a simple power-law model with spectral index in the range 1.5-3.5. Exponential, thermal bremsstrahlung and thermal synchrotron models are statistically inconsistent with the burst sample, although they can adequately describe some of the individual burst spectra. We find good agreement between burst spectra measured simultaneously by BATSE, COMPTEL and EGRET, which typically show a spectral transition or 'break' in the BATSE energy range around a few hundred keV followed by simple power law emission extending to hundreds of MeV. However, the temporal relation between MeV and GeV (e.g. as measured by EGRET) burst emission is still unclear. Measurement of rapid variability at MeV energies in the stronger bursts provides evidence that, in general, sources of these bursts are nearby (within the Galaxy) or the gamma-ray emission is relativistically beamed.
Active Galactic Nuclei (AGN)
COMPTEL has detected gamma-ray emission from seven AGN:
3C273, 3C279 (e.g. Williams et al., 1995a), PKS 0528+134 (Collmar
et al., 1994), CTA 102, 4C454.3 (Blom et al., 1995), PKS 0208-512
and Cen A (Steinle et al., 1995). Apart from the last, all are
blazar-type objects with bright, flat-spectrum radio cores. The
OSSE, COMPTEL and EGRET instruments on CGRO are discovering an
increasing number of such blazars, which emit a substantial
amount of their energy in the gamma-ray region (see e.g. Dermer
& Gehrels, 1995). The combined results of the CGRO instruments
generally indicate spectral breaks within 1-50 MeV, i.e. in or
near the COMPTEL energy range.
In addition, four other high galactic latitude sources have been detected: GRO J0516-609 (Bloemen et al., 1995), GRO J1753+57 (Williams et al., 1995b), GRO J1040+48 (Iyudin et al., 1996) and GRO J1214+06 (Collmar et al., 1996). Of these, GRO J0516-609 is almost certainly a blazar, but cannot be uniquely identified since two possible candidates, PKS 0522-611 and PKS 0506 612, lie within the 99% confidence location contour. The others might also be AGN, but counterpart searches (e.g. Carramimana et al., 1996) have failed to identify promising candidates. Alternative explanations, such as high velocity clouds, have been sought.
Most, if not all, of the AGN observed by COMPTEL exhibit considerable variability in their emissions. This is illustrated in Fig. 4.3.1.1/4, which shows spectra for PKS 0208-512, showing simultaneous COMPTEL and EGRET results derived from a combination of observations covering more than 3 years.
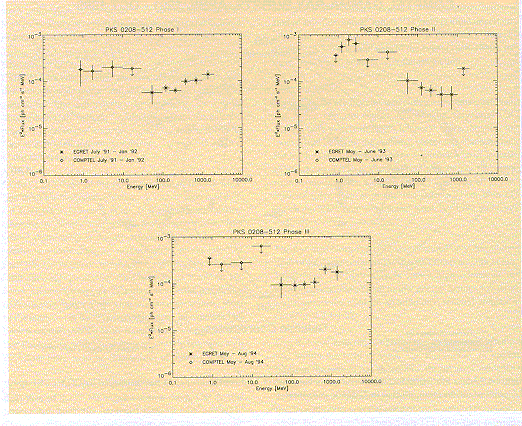
Figure 4.3.1.1/4: Spectra of the radiated power per decade of
energy for PKS 0208-512, showing simultaneous COMPTEL and EGRET
results derived from combining observations in the periods July
1991 to January 1992 (left), May 1993 to June 1993 (right) and
May 1994 to August 1994 (bottom).
Evidence for a sub-class of AGN that is exceptionally bright at MeV energies has been found (e.g. Blom et al., 1996), the most obvious being PKS 0208-512 and GRO J0516-609. These MeV blazars seem to place strong constraints on proposed blazar emission models. It is now generally assumed that the blazar gamma-ray emission is produced in relativistic jets directed towards the observer. Whereas the mm and optical emission is synchrotron radiation, the X-ray and gamma-ray emission arises from inverse Compton scattering of, for example, the synchrotron radiation, from an accretion disc. The spectral breaks in the MeV region, revealed by joint fitting of COMPTEL/EGRET data (e.g. Williams, 1995a; Blom, 1996), are easily explained by such a scenario, but the extreme MeV emission of PKS 0208-512 and GRO J0516 609 is not. It may result from the blue-shifted annihilation radiation ejected in a jet.
References
Bloemen, H., Bennett, K., Blom, J.J. et al. (1995).
A&A 293, L1.
Blom, J.J., Bennett, K., Bloemen, H. et al. (1995).
A&A 298, L33.
Carramimana, A., Guichard, J., Williams, O.R. & Much,
R. (1996). Proc. 3rd Compton Symposium. A&AS, in
press.
Collmar, W., Bennett, K., Bloemen, H. et al. (1996). Proc.
3rd Compton Symposium. A&AS, in press.
Collmar, W., Diehl, R., Lichti, G.G. et al. (1994).
AIP Conference Proceedings 304, 659.
Hanlon, L.O., Bennett, K., Collmar, W. et al. (1994).
A&A 285, 161.
Iyudin, A.F., Bennett, K., Bloemen, H. et al. (1996).
A&A 311, L21.
Iyudin, A.F., Diehl, R., Bloemen, H. et al. (1994).
A&A 284, L1.
Much, R., Harmon, B.A., Nolan, P. et al. (1996).
A&AS, in press.
Oberlack, U., Bennett, K., Bloemen, H. et al. (1996).
Proceedings 3rd Compton Symposium. A&AS, in press.
Ryan, J., Bennett, K., Collmar, W. et al. (1994). ApJ
422, L67.
Steinle, H., Bennett, K., Bloemen, H. et al. (1995). Adv.
Space Res. 15, (5), 37.
Williams, O.R., Bennett, K., Bloemen, H. et al. (1995a).
A&A 298, 33.
Williams, O.R., Much, R., Bennett, K. et al. (1995b).
A&A 297, L21.
Winkler, C., Kippen, R.M., Bennett, K. et al. (1995).
A&A 302, 765.
van Dijk, R. (1996). PhD thesis, University of Amsterdam.
van Dijk, R., Bennett, K., Collmar, W. et al. (1995).
A&A 296, L33.
Many people in and associated with the Division have contributed, in the reporting period, to the design, development, testing and now operation of the SAX LECS hardware and software, including: A.N. Parmar, M. Bavdaz, F. Favata, E. Kuulkers, U. Lammers, D.D.E. Martin, A. Owens, G. Vacanti, M. Adriaens, S. Andersson, A. Peacock and B.G. Taylor.
The Italian/Dutch SAX X-ray satellite was launched from Cape Canaveral by an Atlas 1 rocket on 30 April 1996 at 4:31 UTC. SAX carries the Low-Energy Concentrator Spectrometer (LECS) instrument provided by the Astrophysics Division. After a nominal lift-off, the Centaur upper stage placed SAX into an almost exactly circular orbit with a height of 600 km and an inclination of 3.2°. Following launch, the satellite entered its commissioning phase, when the performance of each of the major subsystems was characterised. This lasted for 2 months and was completed when the instruments made their first observations of a cosmic X-ray source the black hole candidate Cygnus X-1 (Piro et al., 1996). The Science Verification Phase, wherein a number of well-studied X-ray sources were observed in order to characterise the performance of the payload, was largely completed by September 1996, and Core Programme observations are now being routinely made.
SAX, an acronym for 'Satellite Italiano per Astronomia a raggi X', now renamed 'BeppoSAX' in honour of physicist Giuseppe Occhialini, is the first X-ray mission sensitive in the very broad energy range 0.1-300 keV. The Narrow Field Instruments (NFIs) have approximately 1° fields of view, and comprise the imaging low and medium energy concentrator spectrometers (LECS, 0.1-10 keV; MECS, 1-10 keV), and the non-imaging high pressure gas scintillation proportional counter (HPGSPC, 3-120 keV) and phoswich detector system (PDS, 15-300 keV). All the NFIs are coaligned and are normally operated simultaneously. In addition, the payload includes two wide field cameras (WFC, 2-30 keV) that observe in directions perpendicular to the NFIs. These allow the detection of X-ray transient phenomena, as well as long-term variability studies. SAX is expected to make 1000-2000 observations of cosmic X-ray sources during its projected 4-year lifetime.
This unique combination of sensitivity and broadband energy coverage will be important for many types of objects such as:
SAX observing time is divided into a Core Programme open to PIs from Italian and Dutch institutes and from the Astrophysics Division and the Max Plank Institut for Extraterrestrische Physik. The first SAX Announcement of Opportunity (AO1) was issued in July 1995 and a total of 309 proposals was received. Of these, 186 were for the Core Programme and 123 for the Guest Observer Programme. The requested observing time was approximately five times as much as could be accepted by the Time Allocation Committee. During AO1, 80% of the observing time is reserved for the Core Programme, with the remaining time being open to proposals from PIs worldwide. The reserved fraction decreases to 60% during the second year of operations (AO2) and 50% in subsequent years.
The Astrophysics Division contribution to the SAX project was to design, develop and build LECS. In return, the Division is guaranteed a fraction of the Core Programme observing time. In order to achieve the extended low energy response, LECS utilises two key hardware developments:
In contrast to conventional GSPCs, LECS dispenses with separate drift and scintillation regions since such a configuration would compromise the low energy response by electron losses to the window and grid. A detailed description of the instrument, its calibration and software system, is to be found in Parmar et al. (1997). LECS operates at 0.1-10 keV, but it is below about 0.5 keV where the instrument really comes into its own. Here, it provides better energy resolution than previous non-dispersive instruments such as the Position Sensitive Proportional Counter (PSPC) on ROSAT or the Solid State Imaging Spectrometer (SIS) on ASCA, as well as providing time resolution of up to 16 µs.
The LECS background counting rate found in orbit is lower than predicted from laboratory measurements and does not vary significantly around the orbit. This is one of the benefits of the very low inclination orbit. The lack of any obvious features from materials used in the construction of LECS indicates that plasma ingress through the X-ray optics, a concern prior to launch, is not a problem. This unique instrument and its several subsystems is performing very well but two difficulties have been encountered. The first is excess photomultiplier noise seen when the instrument is operated in daylight, most likely due to Earth- shine being inadequately rejected by the telescope baffling system, entering the detector through the ultra-thin entrance windows. This effect is currently restricting LECS operations to the night-time part of the orbit. However, a series of test observations has confirmed that LECS can be operated during daytime when it is pointing away from Earth; the range of angles that can be used is under investigation. The second problem is that the microprocessor in the LECS Electronic Unit occasionally undergoes an autonomous reset, resulting in loss of data until the instrument is reconfigured. The 'reboots' are clustered around a period some 10 min after SAX enters sunlight and result in the loss of some 10% of data. The mechanism responsible for these incidents is under investigation and the operational workarounds necessary to minimise the data loss are being prepared. The lower-than-expected background counting rate partially compensates for these two problems.
The 'first light' image of Cygnus X-1 taken on 22 June, when it was in its rarely occurring high soft state, is shown in Fig. 4.3.1.2/1. Cygnus X-1 is located about 10 arcmin from the centre of the field of view; two internal calibration sources are visible in the lower left and upper right corners. (These lie outside the instrument's field of view, as does the 'ghost' image of Cygnus X-1 at the upper right edge of the image.) The intensity scaling is logarithmic to enhance the visibility of low intensity features. The point spread function is almost identical to that measured on the ground, indicating that the spacecraft pointing is stable and that the instrument is working well. The Cygnus X-1 spectrum can be represented by an absorbed power-law and blackbody model with a best-fit temperature of 0.430±0.004 keV, a power-law photon index of 2.46±0.06 and low energy absorption equivalent to (4.3±0.2)x1022H atoms/cm2. Both this model, and the best-fit values, are similar to those determined by ASCA on 30 May 1996, demonstrating the good status of the LECS calibration. This has been further demonstrated by a SAX NFI observation of the X-ray 'standard candle', the Crab Nebula. Although the Crab is not seen below about 0.5 keV because of interstellar absorption, the observed LECS spectrum is well represented by the canonical, featureless, absorbed power-law model.
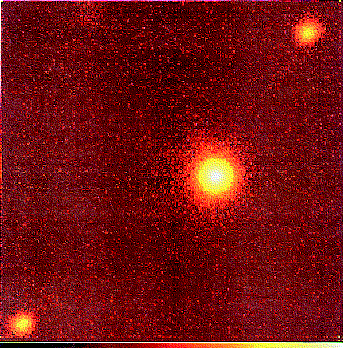
Figure 4.3.1.2/1: The first light SAX LECS image (logarithmic
scaling) of the black hole candidate Cygnus X-1. The two internal
calibration sources are visible in the lower left and upper
right. These lie outside the instrument's field of view, as does
the 'ghost' image at the upper left edge of the image.
Some idea of the quality of data being obtained by LECS is shown in Figs. 4.3.1.2/2 to /5, which show spectra of an AGN, an active stellar system, a supernova remnant and an X-ray binary. The good performance for line-dominated spectra is revealed in Fig. 4.3.1.2/2, which shows the spectrum obtained from an observation of the supernova remnant Cas A on 6 August 1996. This source is a prime LECS calibration target since its strong line emission allows an accurate energy calibration. Emission features from magnesium, silicon, sulphur, argon, calcium and iron are visible. The low energy cutoff present below about channel 100 (corresponding to ~1 keV) is due to interstellar absorption. The best-fitting spectral model, consisting of absorbed two- temperature variable abundance non-equilibrium plasma emission, is shown as a continuous line, with the residuals displayed in the lower panel.
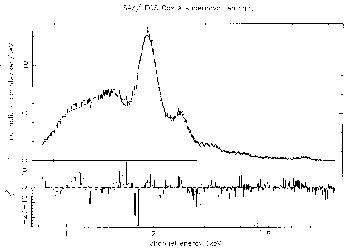
Figure 4.3.1.2/2: The SAX LECS spectrum of the supernova
remnant Cas A, showing line emission due to Mg, Si, S, Ar, Ca and
Fe. The best-fit two-temperature variable abundance plasma
emission model is shown as a continuous line.
The good low energy response of LECS provides a powerful diagnostic for the characterisation of thermal plasmas. In line- dominated plasma spectra such as the spectrum of Capella, shown in Fig. 4.3.1.2/3, much of the emission is concentrated at around 1 keV. LECS, with its good spectral resolution and low energy response, is well suited to the study of such emission. While current CCD detectors (such as SIS), have better spectral resolution than LECS, they have little response below 0.5 keV, and thus are sensitive only to the region of the X-ray spectrum where a typical line-dominated spectrum is falling off rapidly. Detectors with a good low energy response have been, up to now, normally proportional counters (such as ROSAT's PSPC) and have had significantly worse spectral resolution than LECS. Thus, the combination of good spectral resolution and low energy response will allow LECS to make a unique contribution to several areas of coronal physics that are currently the subject of much debate. In particular, results from ASCA show evidence for surprisingly low metal abundances from many coronal X-ray sources. LECS spectra will allow the determination of metal abundances using different diagnostics than ASCA's. In particular, the ratio between the line-free continuum at low energies and the strength of the Fe emission complex around 1 keV is a sensitive diagnostic of the metal abundance that is not easily accessible to other currently available X-ray detectors.
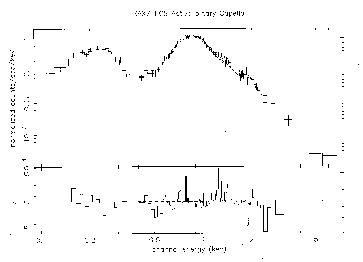
Figure 4.3.1.2/3: The SAX LECS spectrum of the coronal X-ray
source Capella taken from a LECS AO1 observation. The exposure
time is 12 ks. The best-fit two-temperature plasma emission model
is shown as a continuous line with the residuals beneath.
The LECS spectrum of the bright Seyfert I galaxy MCG-6-30-15 obtained during a 97 ks exposure from 29 July to 3 August 1996 is shown in Fig. 4.3.1.2/4. The X-ray spectrum of this object is complex. At energies above a few keV, the effects of irradiation of cold material by a power-law continuum producing a hard reflection component and fluorescent iron line are evident. A low energy excess is visible in this source, together with an absorption feature due to partially ionised oxygen in the line of sight to the active nucleus. Since the absorbing medium appears to be at a temperature of about 105K, it is known as a 'warm absorber'. Studies of this feature can provide information about the location and properties of the material surrounding the active nucleus as well its relation to the ionising continuum. Fig. 4.3.1.2/4 illustrates how the extended low energy response of LECS may be used to provide better constraints on the nature of the absorbing components than previously possible. The continuous line shows the best-fitting spectral model consisting of a power-law together with edges at fixed energies appropriate to OV II and OV III. In addition, the number of counts below 0.28 keV indicates the need for excess intrinsic neutral absorption above the Galactic value. Intriguingly, there is some evidence for an emission feature near 0.6 keV, which may have been seen during a long ASCA observation but could plausibly be of instrumental origin in the SIS. The possible detection of a similar feature in a different type of instrument adds weight to an astronomical interpretation.
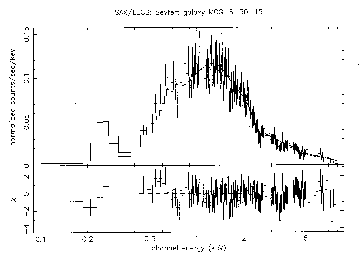
Figure 4.3.1.2/4: The SAX LECS spectrum of the Seyfert I
galaxy MCG-6-30 15 obtained during a 97 ks exposure. The best-fit
spectral model, described in the text, is shown as a continuous
line.
The LECS spectrum of the X-ray binary Her X-1, obtained during part of the main 'on' state of the 35-day cycle that occurred at the end of July 1996, is shown in Fig. 4.3.1.2/5. As well as a 35-day cycle of high and low X-ray states, whose origin remains a mystery, Her X-1 displays 1.7-day eclipses as well as 1.24 s pulsations. Prior to eclipses, a series of absorption dips are often seen (e.g. Reynolds & Parmar, 1995). The spectrum presented in Fig. 4.3.1.2/5 excludes eclipses and dips and can be represented by absorbed power-law and blackbody continuum emission components, together with emission features at around 1.0 keV and 6.4 keV. The high count rate at energies below the detector entrance window's absorption edge at 0.28 keV arises mostly from a poorly understood, and rarely observed, 'blackbody' component. In particular, the physical mechanism responsible for the low energy X-rays, their dependence on orbital and 35-day phases, their relation with the hard X-ray emission, their detailed spectral shape and their production site, are all open questions. The good low energy response and broadband coverage of LECS, together with the long SAX observation of Her X-1, will allow these issues to be addressed in a systematic fashion for the first time.
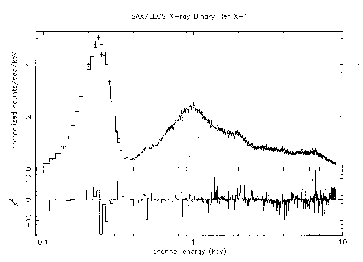
Figure 4.3.1.2/5: The SAX LECS spectrum of the X-ray binary
Her X-1 during part of a 35 day main 'on' state. The best-fit
spectral model, described in the text, is shown as a continuous
line.
References
Parmar, A.N., Martin, D.D.E., Bavdaz, M. et al. (1997).
A&AS 122, 309.
Piro, L., Butler, R.C., Boella, G. et al. (1996). IAU
Circ. 6341.
Reynolds, A.P. & Parmar, A.N. (1995). A&A 297,
747.
The following members of the division have been involved in the STJ programme: C. Erd, R. den Hartog, F.A. Jansen, D. Lumb, A. Peacock, A. Poelaert and N. Rando for laboratory development, P. Verhoeve for experimental physics, material diagnostics and data analysis, S. Andersson and A. van Dordrecht for electronics, J. Verveer for cryogenics and J. van der Biezen for device diagnostics such as scanning electron and atomic force microscopy. This team has been working with M.A.C. Perryman, F. Favata and P. Jakobsen, who are pursuing the potential astronomical applications.
The division has been involved over a number of years with the development of superconducting tunnel junctions (STJs) as photon- counting detectors for a wide range of applications. Originally, the aim was to develop an imaging high resolution spectrometer covering 1-100 Å with a resolution of Delta-lambda~0.05Å at 10 Å. This aim has broadened as the potential application and performance of these devices in the UV and through the optical to the near-IR have been realised and demonstrated.
A variety of astronomical observations at optical and UV wavelengths would benefit from a detector combining the best attributes of the CCD with those of the best photon-counting systems: an efficient detector covering a wide wavelength range from the Lyman limit to the near-IR that can simultaneously provide the wavelength, time of arrival and location of every photon falling on the detector from the widest possible field. A detector that possesses the ability to measure the wavelength of individual optical photons intrinsically has not previously existed.
Perryman, Foden & Peacock (1993) noted that a super- conductor is theoretically capable of detecting individual optical/UV photons and also of measuring the photon energy, thus opening the way for a powerful new optical detector concept, with high quantum efficiency, that can operate even at high incident count rates. The STJ's performance arises from the very small energy gap (Delta,of order meV) in a superconductor between the ground state, as represented by the bound Cooper electron pairs, and the first excited state, containing broken Cooper pairs. The following report does not enter into the theoretical details of the STJ, but concentrates on unique laboratory results on detectors functioning in the optical region. The developments in the sensitivity of STJs over the last 2 years has been so significant that such a detector now exists covering the wavelength region from the X-ray (~1 Å) up to the near-IR (2.5 µm) (Peacock et al., 1996a, b, c).
The best results to date at optical wavelengths are based on tantalum STJs, shown schematically in Fig. 4.3.1.3/1. These devices consist typically of a 20x20 µm square 100 nm thick epitaxial tantalum film on a smooth sapphire substrate, on top of which a 30 nm thick aluminium trapping layer is deposited. The insulating barrier, of order 1 nm thick, is formed through a controlled oxidation of this aluminium. The oxide barrier is capped by a further 30 nm aluminium trapping layer, followed by a thin interface layer prior to the deposition of 100 nm of polycrystalline tantalum. The leads are normally ~2 µm wide and made of niobium to prevent quasi particle losses down them from the lower bandgap materials of tantalum and aluminium. Further details on these devices can be found in Verhoeve et al. (1996a), while the role of the aluminium trapping layers is discussed in Poelaert et al. (1996).
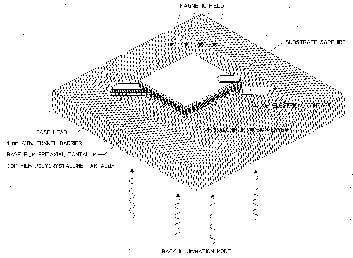
Figure 4.3.1.3/1: Schematic of a tantalum tunnel junction used
in the present experiments together with its orientation in a
parallel magnetic field so as to suppress the Josephson current.
The device is operated in the back-illuminated mode, thereby
limiting the UV response to the cutoff of the substrate.
The important electrical characteristics of such devices can be determined through the investigation of the current-voltage relationship at 0.3 K. The bandgap of the device at the barrier was determined to be Deltabarrier~0.5 meV. This is lower than that for bulk tantalum, DeltaTa , due to the proximity effect of the aluminium trapping layers. The resistivity of the barrier was estimated to be ~2.6x10⁻⁶ omega cm2, while the leakage current was ~50-100 fA/µm2.
Optical experiments are performed in a 3He cryostat at a base temperature of ~0.3 K and illuminated through the sapphire substrate (back-illuminated) by photons through a fibre optic from a monochromated xenon lamp. The illumination was initially at a very low intensity level (of order a few Hz) such that only a single optical photon was incident on the detector during the tunnel and electronics processing time. The back-illuminated mode is preferred for two reasons:
The electrical signals from the STJ are read out using a charge-sensitive amplifier operated at room temperature and placed about 1 m from the device. The amplitude and rise time of this signal are measured to yield the total number of tunnelled electrons (charge output) and signal decay time, respectively. The electronic noise is continuously monitored through the response to an electronic pulse fed into the pre-amplifier.
The detector's response to single photons can be measured at different wavelength settings of the monochromator from the UV (200 nm) to the near-IR (2.5 µm). Sample spectra are shown in Fig. 4.3.1.3/2. The mean charge output <Q>and the FWHM Delta Q provide a determination of the photon wavelength, detector responsivity and measured spectral resolution d lambdaM~DeltaQ/<Q>. A typical responsivity of ~2.5x10⁴ electrons/eV, equivalent to a mean number of tunnels for each charge carrier of <n>~30, can be derived. The peak at the end of the charge range in some of the spectra of Fig. 4.3.1.3/2(a) is due to the equipment used to determine the contribution to the measured resolution from the electronics d lambdaE. At some wavelengths, the second and third order from the monochromator are also apparent, rather nicely illustrating the detector's intrinsic spectroscopic capability. The short and long wavelength limits of 200 nm and 2.5 µm are due to the fibre optic cut-off. Fig. 4.3.1.3/3 illustrates the measured resolution d lambdaM of the device as a function of wavelength. The resolution d lambdaC is simply the resolution after correction for the contribution of the electronics d lambdaE as determined from the constant charge input pulse such that d lambdaC2 = d lambdaM2 - d lambdaE2 . The function for the limiting resolution of the device d lambdaT<n>~30 is also shown. The agreement is rather good, indicating that the detector resolution at these wavelengths is totally dominated by the tunnel noise. The systematic variation between d lambdaC and d lambdaT is probably due to a small spatial variation to the resolution as observed at X-ray wavelengths (Verhoeve et al., 1996 a, b).
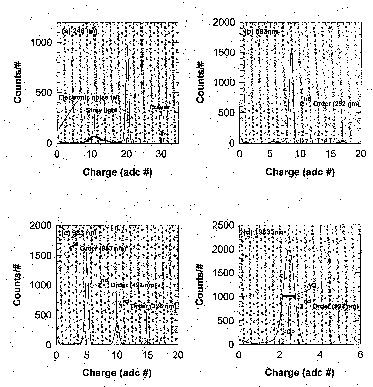
Figure 4.3.1.3/2: The charge spectra obtained from the
junction when illuminated with (a) 246 nm, (b) 583 nm, (c) 983
nm and (d) 1983 nm photons from a monochromatic light source. The
charge is in units of ADC channels recorded by the signal pulse
height analyser (1#=6.24x10³ electrons).
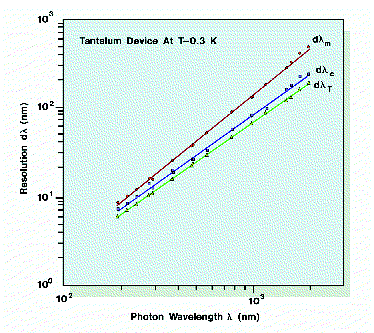
Figure 4.3.1.3/3: The measured (d lambdaM ) and
electronics corrected resolution (deltaC ) as a
function of wavelength. The theoretical variation with photon
wavelength of the Fano plus tunnel noise limited resolution (d
lambdaT )is also shown for the case when
<n>=~30.
These tantalum superconducting tunnel junctions should have considerable potential as photon-counting, broad band, low resolution spectrometers in optical and UV astronomy. The spectroscopic resolution achieved in the laboratory is close to the theoretical limit for symmetrical tunnel junctions of below 10 nm at wavelengths shorter than 300 nm. The key features of this new class of optical detector can therefore be summarised as follows:
Future developments will involve the practical astronomical application of such devices through the development of arrays. The first of these have already been fabricated and are under evaluation (Jansen et al., 1996). The medium-term goal is to have a small (6 6) array operational at the William Herschel Telescope on La Palma for astronomical observations directed mainly at high time-resolution astrophysical phenomena early in 1998.
With its promise of unprecedented high quantum efficiency in the UV, the STJ detector is a candidate for a future instrument on the Hubble Space Telescope. In collaboration with other European and US institutions, the Division is preparing a proposal in response to NASA's Announcement of Opportunity for new HST instruments to be installed during the fourth HST Servicing Mission, scheduled for 2002. The proposal aims at capitalising not only on the Division's development of the STJ detector, but also on the availability of the prerequisite mechanical cooler technology within Europe, largely funded through ESA's Technological Research Programme.
References
Jansen, F.A., Peacock, A., Verhoeve, P., Rando, N. & den
Hartog, R.. (1996). SPIE 2808, 516-522.
Peacock, A., Verhoeve, P., Rando, N., van Dordrecht, A.,
Taylor, B.G., Erd, C., Perryman, M.A.C., Venn, R., Howlett, J.,
Goldie, D.J., Lumley, J. & Wallis, M. (1996a). Nature,
381, 135.
Peacock, A., Verhoeve, P., Rando, N., van Dordrecht, A., Erd,
C., Perryman, M.A.C., Venn, R., Howlett, J., Goldie, D.J.,
Lumley, J. & Wallis, M. (1996b). J. Appl. Phys.,
submitted.
Peacock, A., Verhoeve, P., Rando, N., Perryman, M.A.C.,
Taylor, B.G. & Jakobsen, P. (1996c). A&ASS, in
press.
Perryman, M.A.C., Foden, C.L. & Peacock, A.
(1993). Nucl. Instr. Meth., A325, 319.
Poelaert, A., Verhoeve, P., Rando, N., Peacock, A., Goldie,
D. & Venn, R. (1996). SPIE 2808, 523-533.
Rando, N., Peacock, A., van Dordrecht, A., Foden, C.L.,
Engelhardt, R., Taylor, B.G., Gare, P., Lumley, J. & Pereira,
C. (1992). Nucl. Instr. Meth., A313, 173.
Verhoeve, P., Rando, N., Peacock, A., van Dordrecht, A.,
Poelaert, A., Goldie, D. & Venn, R. (1996a). App.
Superconductivity Conf., in press.
Verhoeve, P., Rando, N., Verveer, J., van Dordrecht, A.,
Peacock, A., Videler, P., Bavdaz, M., Goldie, D.J., Lederer, T.,
Scholze, F., Ulm, G. & Venn, R. (1996b). Phys. Rev. B.,
53, 2, 809.


 SP1211