Space sensors shed new light on air quality
Air pollution is becoming one of the biggest dangers for the future of the planet, causing premature deaths of humans and damaging flora and fauna. With their vantage point from space, satellites are the only way to carry out effective global measurements of air-polluting emissions and their transboundary movement.
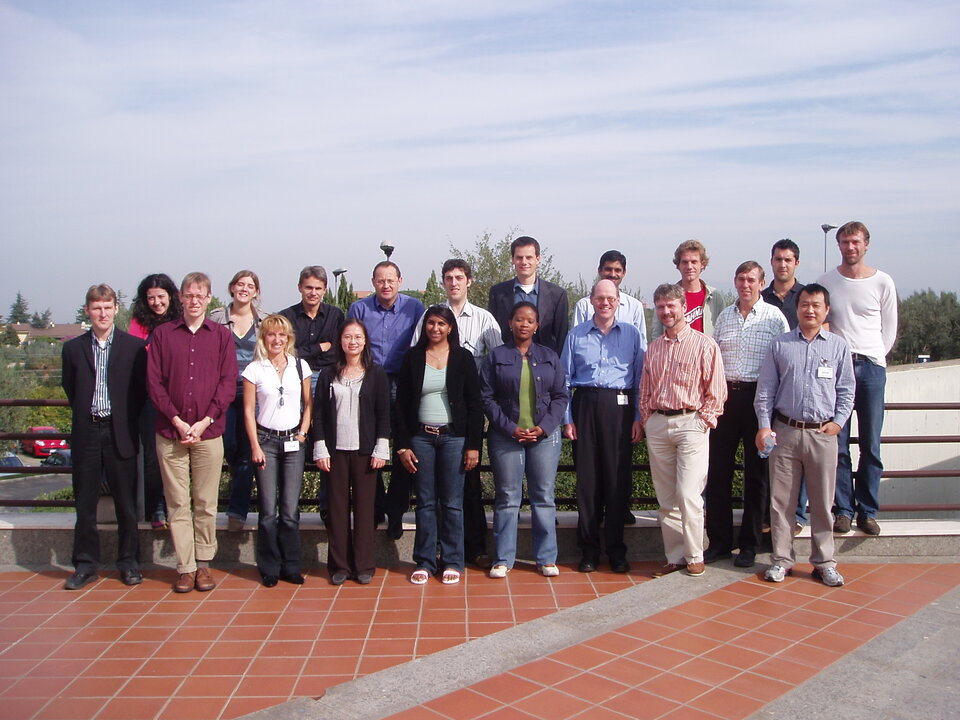
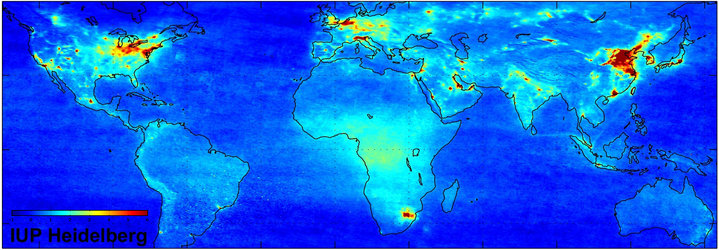
Scientists and researchers from around the world gathered at ESRIN, ESA’s Earth Observation Centre in Frascati, Italy, last week to discuss the contribution of satellite data in monitoring nitrogen dioxide in the atmosphere and to present the latest results of their ongoing atmospheric research that includes identifying hotspots, analysing trends and monitoring the effectiveness of mitigation efforts.
All of the satellite data used by the participants was acquired through the TEMIS project, part of ESA’s Data User Programme (DUP). The TEMIS Internet-based service offers near-real time data products, long-term data sets and forecasts from various satellite instruments related to tropospheric trace gas concentrations, aerosol and Ultra Violet radiation.

Emissions of gaseous pollutants have increased in India over the past two decades. According to Dr Sachin Ghude of the Indian Institute of Tropical Meteorology (IITM), rapid industrialisation, urbanisation and traffic growth are most likely responsible for the increase. Because of varying consumption patterns and growth rates, the distribution of emissions vary widely across India. In order to mitigate the causes of pollution, policy makers need to know the hardest hit regions.
Using nitrogen dioxide (NO2) data acquired from 1996 to 2006 by the Global Ozone Monitoring Experiment (GOME) instrument aboard ESA’s ERS-2 satellite and the Scanning Imaging Absorption Spectrometer for Atmospheric Chartography (SCIAMACHY) instrument aboard ESA’s Envisat, Ghude was able to identify the major NO2 hotspots, quantify the trend over major industrial zones and identify the largest contributing regions.
"Nitrous oxide emissions over India is growing at an annual rate of 5.5 percent/year and the location of emission hot spots correlates well with the location of mega thermal power plants, mega cities, urban and industrial regions," Ghude said. "Data from the 11-year time series of GOME and SCIAMACHY provide valuable information to improve estimates of nitrogen dioxide emissions as well as to identify the source regions and to study the regional ozone chemistry in light of seasonal meteorology."

Because of the near-real time aspect of the TEMIS service, Yuxuan Wang, lecturer and research assistant at Harvard University, was able to obtain accurate measurements of the air quality over China during a traffic restriction using data from the Ozone Monitoring Instrument (OMI) instrument on NASA’s Aura satellite.
Between 4 and 6 November 2006, 30 percent – or 800 000 – of Beijing's 2.82 million private vehicles were taken off the streets to facilitate organisation for the China-African summit and to perform a trial for the 2008 Olympic Games.
By comparing the satellite observations with ground measurements and a global chemical transport model, Wang and her colleagues learned that the model did not capture the full amount of decrease in NO2 over Beijing during the summit.
"Because the satellites witnessed this event, we could draw a quantitative analysis of how much reduction happened by using this independent dataset. We saw a 40 percent reduction in nitrogen dioxide emissions," Wang said.
"TEMIS offers near real time data, allowing me to see daily measurements over Beijing with about a 2-hour time lag. When our group knows about traffic restrictions, we just go to the TEMIS website, download the data from that day and see whether there is a reduction in emissions picked up by satellites," she continued. "TEMIS, which allows very easy and open data access, is a big contribution of ESA to the whole community, not only for the European users but across the world, especially for places without in situ measurements."

Simon Hales, Senior Research Fellow at the University of Otaga in New Zealand, is using satellite data from TEMIS to look at seasonal patterns of heart disease in New Zealand for the National Heart Foundation and to assess the global burden of disease related to air pollution.
"The big advantage of using satellite data from the point of view of public health is that it gives us spatially extensive coverage that we do not get any other way," he explained. "Because newer instruments like SCIAMACHY and OMI are able to approximate some of the vertical profiles of NO2, you have a better idea of what people are actually being exposed to on the ground."
By using NO2 satellite data and relating it to surface observations, Hales hopes to develop a model of the surface exposure levels, determine what the exposure levels mean in terms of public health implications and work out what the policy implications are for changing emission-releasing practices, such as reducing transport from motor vehicles.
The service providers are currently planning to expand the existing TEMIS service to monitor the transboundary and hemispheric movement of air pollution.


 Germany
 Austria
 Belgium
 Denmark
 Spain
Spain
 Estonia
 Finland
 France
 Greece
 Hungary
 Ireland
 Italy
Italy
 Luxembourg
 Norway
 The Netherlands
 Poland
 Portugal
 Czechia
 Romania
 United Kingdom
 Slovenia
 Sweden
 Switzerland


