Understanding climate tipping points
As the planet warms, many parts of the Earth system are undergoing large-scale changes. Ice sheets are shrinking, sea levels are rising and coral reefs are dying off.
While climate records are being continuously broken, the cumulative impact of these changes could also cause fundamental parts of the Earth system to change dramatically. These ‘tipping points’ of climate change are critical thresholds in that, if exceeded, can lead to irreversible consequences.
What are climate tipping points?
According to the Intergovernmental Panel on Climate Change (IPCC), tipping points are ‘critical thresholds in a system that, when exceeded, can lead to a significant change in the state of the system, often with an understanding that the change is irreversible.’
In essence, climate tipping points are elements of the Earth system in which small changes can kick off reinforcing loops that ‘tip’ a system from one stable state into a profoundly different state.
For example, a rise in global temperatures because of fossil fuel burning, further down the line, triggers a change like a rainforest becoming a dry savannah. This change is propelled by self-perpetuating feedback loops, even if what was driving the change in the system stops. The system – in this case the forest – may remain ‘tipped’ even if the temperature falls below the threshold again.
This shift from one state to the other may take decades or even centuries to find a new, stable state. But if tipping points are being crossed now, or within the next decade, their full impact might not become apparent for hundreds or thousands of years.


Access the video
On top of that, the crossing of one tipping point could lead to the triggering of further tipping elements – unleashing a domino-effect chain reaction and could lead to some places becoming less suitable for sustaining human and natural systems.
For example: the Arctic is warming almost four times faster than anywhere else in the world, accelerating ice melt from the Greenland Ice Sheet (and the melting of Arctic sea ice).
This in turn could be what is slowing down the ocean’s circulation of heat, the Atlantic Meridional Overturning Circulation (AMOC), in turn impacting the monsoon system over South America. Monsoon changes may be contributing to the rising frequency of droughts over the Amazon rainforest, lowering its carbon storage capacity and intensifying climate warming.
The impacts of such a ‘tipping cascade,’ crossing multiple climate tipping points, could be more severe and widespread.
Climate tipping elements
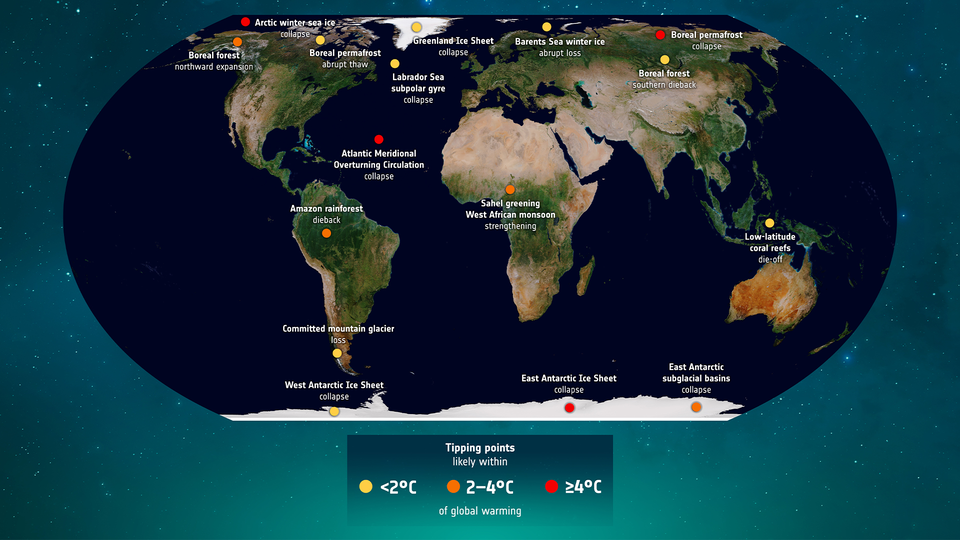
In the early 2000s, a range of tipping elements were first identified and were thought that they would be reached in the event of a 4°C increase in global temperatures. Since then, science has advanced tremendously and there have been many studies on tipping-point behaviour and interactions among tipping-element systems.
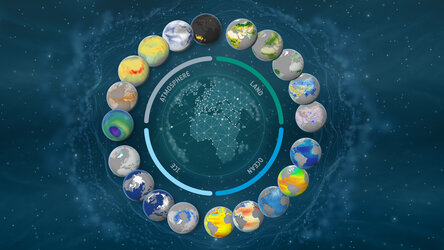
These elements broadly fall into three categories — cryosphere, ocean-atmosphere, and biosphere — and range from the melting of the Greenland ice sheet to the death of coral reefs.
According to the newly-published Global Tipping Points Report, five major tipping systems are already at risk of crossing tipping points at the present level of global warming: the Greenland and West Antarctic ice sheets, permafrost regions, coral reef die-offs and the Labrador Sea and subpolar gyre circulation.
Click on the infographic below to learn more about each climate tipping point.
What can satellites reveal about climate tipping points?
Our planet has already warmed by roughly 1.2°C since the Industrial Revolution and current pledges under the Paris Agreement put us on track to increase that to 2.5–2.9°C temperature rise this century. Recent assessments found that even exceeding 1.5°C of global warming risks crossing several of these thresholds for tipping points.
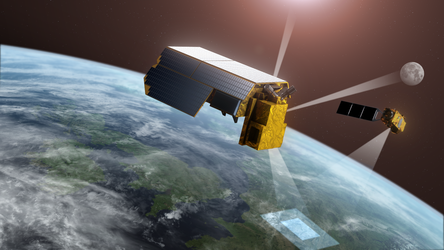
Earth observation plays a crucial role in monitoring and understanding climate tipping points by providing a comprehensive view of the Earth's systems. Satellites orbiting our planet enable scientists to track changes in polar ice sheets, and their glaciers and ice shelves, deforestation rates, ocean temperatures and other key indicators.
For instance, satellites such as ESA’s CryoSat and Copernicus Sentinel-1 can measure changes in ice volume and flow. Satellites that provide information on gravity can work out how much ice is being lost in polar regions, helping to identify potential tipping points in ice sheet stability and the pace of their response to climate change.
Optical satellites like Sentinel-2 contribute to monitoring changes in land cover or vegetation, such as the expansion or decline of critical ecosystems like the Amazon rainforest.
ESA’s Soil Moisture and Ocean Salinity (SMOS) satellite and the upcoming Fluorescence Explorer (FLEX) mission contribute to monitoring soil moisture and vegetation health. These missions can aid in understanding changes in terrestrial ecosystems and their resilience to climate impacts.
In the context of ocean circulation patterns, satellites like Sentinel-3 and SMOS contribute to monitoring sea surface temperatures, currents, ocean colour and sea surface salinity, providing insights into the strength and dynamics of the Atlantic Meridional Overturning Circulation.
By capturing a wide spectrum of data, satellites provide essential information for early detection of environmental shifts, enhancing our understanding of these complex phenomena and aiding in developing effective strategies for climate mitigation and adaptation.


 Germany
 Austria
 Belgium
 Denmark
 Spain
Spain
 Estonia
 Finland
 France
 Greece
 Hungary
 Ireland
 Italy
Italy
 Luxembourg
 Norway
 The Netherlands
 Poland
 Portugal
 Czechia
 Romania
 United Kingdom
 Slovenia
 Sweden
 Switzerland


