Accept all cookies Accept only essential cookies See our Cookie Notice

About ESA
The European Space Agency (ESA) is Europe’s gateway to space. Its mission is to shape the development of Europe’s space capability and ensure that investment in space continues to deliver benefits to the citizens of Europe and the world.
Highlights
ESA - United space in Europe
This is ESA ESA facts Member States & Cooperating States Funding Director General Top management For Member State Delegations European vision European Space Policy ESA & EU Space Councils Responsibility & Sustainability Annual Report Calendar of meetings Corporate newsEstablishments & sites
ESA Headquarters ESA ESTEC ESA ESOC ESA ESRIN ESA EAC ESA ESAC Europe's Spaceport ESA ESEC ESA ECSAT Brussels Office Washington OfficeWorking with ESA
Business with ESA ESA Commercialisation Gateway Law at ESA Careers Cyber resilience at ESA IT at ESA Newsroom Partnerships Merchandising Licence Education Open Space Innovation Platform Integrity and Reporting Administrative Tribunal Health and SafetyMore about ESA
History ESA Historical Archives Exhibitions Publications Art & Culture ESA Merchandise Kids Diversity ESA Brand Centre ESA ChampionsLatest
Space in Member States
Find out more about space activities in our 23 Member States, and understand how ESA works together with their national agencies, institutions and organisations.
Science & Exploration
Exploring our Solar System and unlocking the secrets of the Universe
Go to topicAstronauts
Missions
Juice Euclid Webb Solar Orbiter BepiColombo Gaia ExoMars Cheops Exoplanet missions More missionsActivities
International Space Station Orion service module Gateway Concordia Caves & Pangaea BenefitsLatest
Space Safety
Protecting life and infrastructure on Earth and in orbit
Go to topicAsteroids
Asteroids and Planetary Defence Asteroid danger explained Flyeye telescope: asteroid detection Hera mission: asteroid deflection Near-Earth Object Coordination CentreSpace junk
About space debris Space debris by the numbers Space Environment Report In space refuelling, refurbishing and removingSafety from space
Clean Space ecodesign Zero Debris Technologies Space for Earth Supporting Sustainable DevelopmentApplications
Using space to benefit citizens and meet future challenges on Earth
Go to topicObserving the Earth
Observing the Earth Future EO Copernicus Meteorology Space for our climate Satellite missionsCommercialisation
ESA Commercialisation Gateway Open Space Innovation Platform Business Incubation ESA Space SolutionsLatest
Enabling & Support
Making space accessible and developing the technologies for the future
Go to topicBuilding missions
Space Engineering and Technology Test centre Laboratories Concurrent Design Facility Preparing for the future Shaping the Future Discovery and Preparation Advanced Concepts TeamSpace transportation
Space Transportation Ariane Vega Space Rider Future space transportation Boost! Europe's Spaceport Launches from Europe's Spaceport from 2012Latest

Ozone hole forecast from today to 9 September
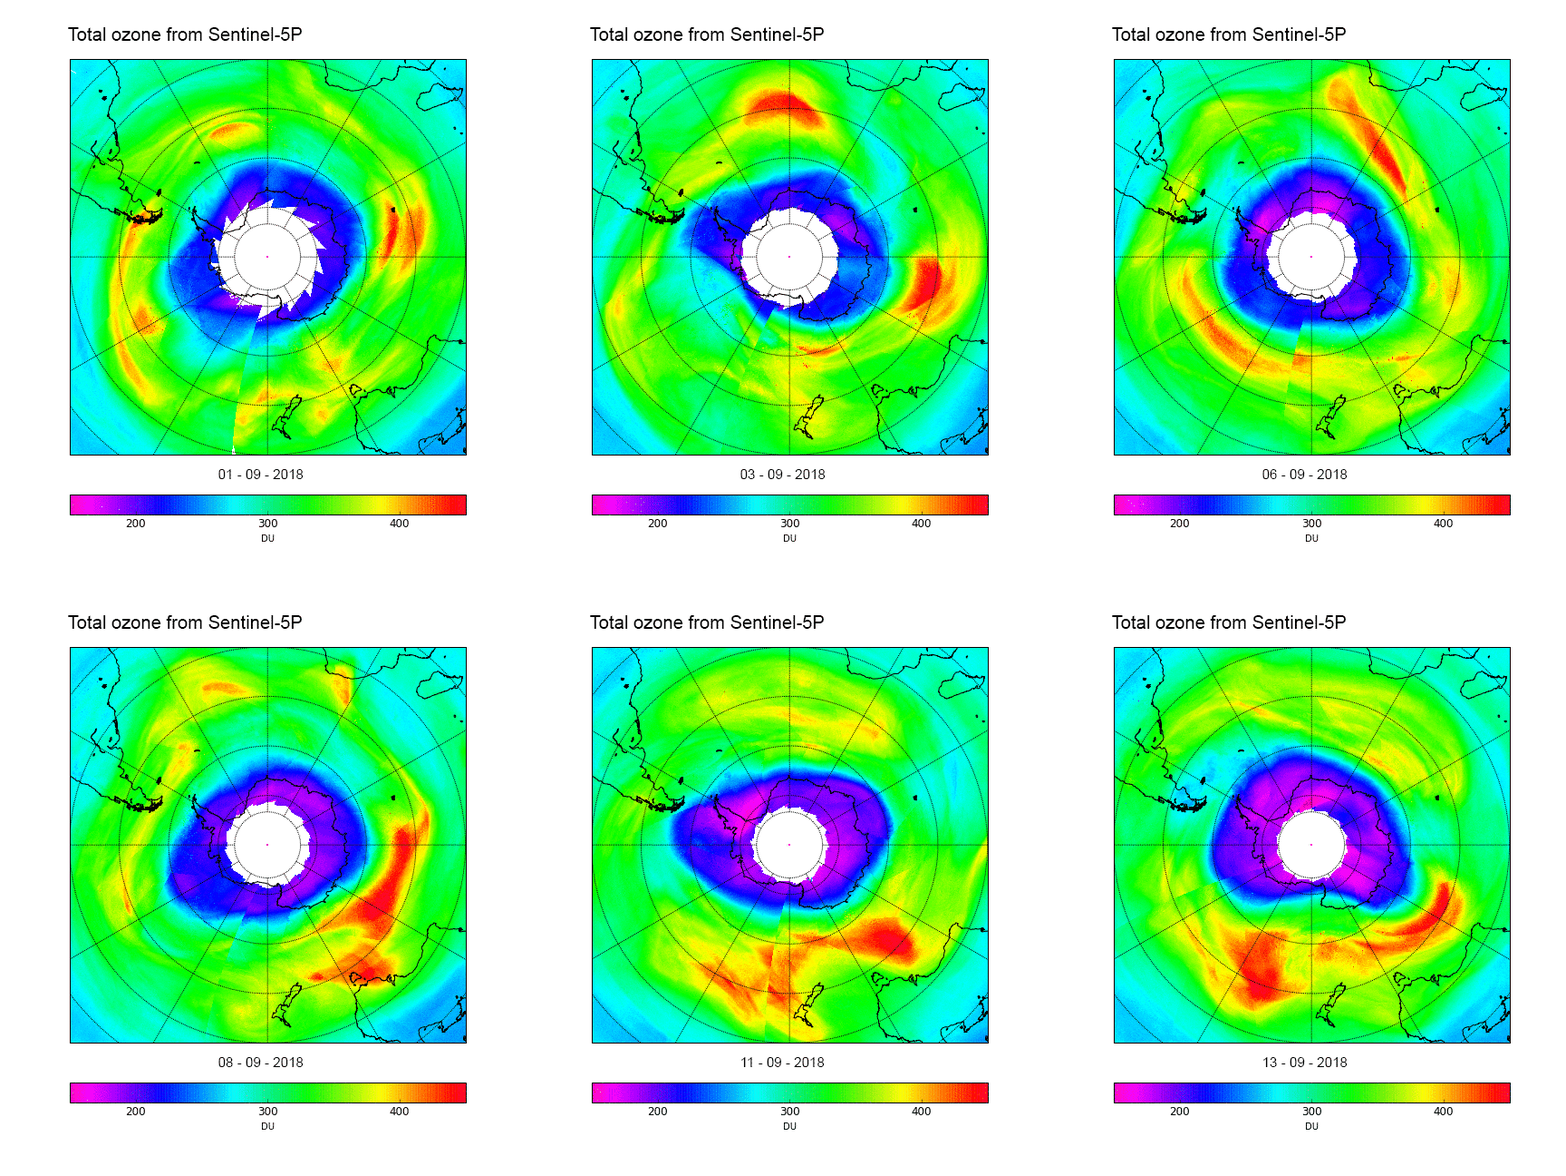
The animation represents the ozone forecast between 1 September to 9 September, showing 2004's emerging ozone hole, as seen by ESA's Envisat environmental satellite. Ozone forecasting is available based on near-real time observations from the Envisat instrument Scanning Imaging Absorption Spectrometer for Atmospheric Cartography (SCIAMACHY), which are inputted into a data assimilation program which provides near-real time ozone fields for today and a forecast for the coming days. The forecast is available through a project called Tropospheric Emission Monitoring Internet Service (TEMIS). The image represents ozone thickness in Dobson Units (DUs), which stands for the total thickness of ozone in a given vertical column if it were concentrated into a single slab at standard temperature and atmospheric pressure – 400 DUs is equivalent to a thickness of four millimetres, for example. The dark blue represents regions with less than 200 DUs.
-
CREDIT
ESA/KNMI -
LICENCE
ESA Standard Licence

Ozone forecast for 1 September

3D rendering of the ozone hole evolution in 2023

Ozone hole, Antarctica

3D rendering of the ozone hole evolution in 2022


 Germany
 Austria
 Belgium
 Denmark
 Spain
Spain
 Estonia
 Finland
 France
 Greece
 Hungary
 Ireland
 Italy
Italy
 Luxembourg
 Norway
 The Netherlands
 Poland
 Portugal
 Czechia
 Romania
 United Kingdom
 Slovenia
 Sweden
 Switzerland


