About ESA
The European Space Agency (ESA) is Europe’s gateway to space. Its mission is to shape the development of Europe’s space capability and ensure that investment in space continues to deliver benefits to the citizens of Europe and the world.
Highlights


Latest


Space in Member States
Find out more about space activities in our 23 Member States, and understand how ESA works together with their national agencies, institutions and organisations.
 Germany
 Austria
 Belgium
 Denmark
 Spain
Spain
 Estonia
 Finland
 France
 Greece
 Hungary
 Ireland
 Italy
Italy
 Luxembourg
 Norway
 The Netherlands
 Poland
 Portugal
 Czechia
 Romania
 United Kingdom
 Slovenia
 Sweden
 Switzerland
Science & Exploration
Exploring our Solar System and unlocking the secrets of the Universe
Go to topicAstronauts


Latest


Enabling & Support
Making space accessible and developing the technologies for the future
Go to topicLatest


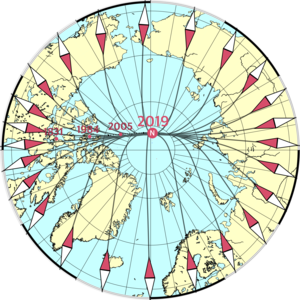
Stormy conditions charted over the North Pole
A plot created by using ice concentration, acquired on 25 August 2006 by the EOS Aqua satellite's AMSR-E instrument (light blue arrows), and ice drift from Envisat's ASAR Global Monitoring Mode data (dark blue arrows), showing the effect stormy conditions have on ice. The ice in the red circle is divergent as a consequence of a low pressure system centred on the North Pole.
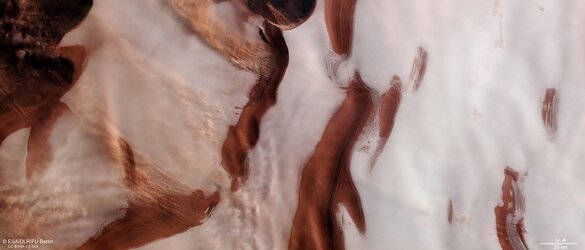
Stormy activity at Mars’ icy north pole

Artist's view of atmospheric vortex over Venus' North pole

AMIE mosaic of North Pole

Artist's view of Venus Express over atmospheric storms