
About ESA
The European Space Agency (ESA) is Europe’s gateway to space. Its mission is to shape the development of Europe’s space capability and ensure that investment in space continues to deliver benefits to the citizens of Europe and the world.
Highlights


Latest


Space in Member States
Find out more about space activities in our 23 Member States, and understand how ESA works together with their national agencies, institutions and organisations.
 Germany
 Austria
 Belgium
 Denmark
 Spain
Spain
 Estonia
 Finland
 France
 Greece
 Hungary
 Ireland
 Italy
Italy
 Luxembourg
 Norway
 The Netherlands
 Poland
 Portugal
 Czechia
 Romania
 United Kingdom
 Slovenia
 Sweden
 Switzerland
Science & Exploration
Exploring our Solar System and unlocking the secrets of the Universe
Go to topicAstronauts


Latest


Enabling & Support
Making space accessible and developing the technologies for the future
Go to topicLatest


Bright lower echo from Mars’ south-polar layered deposits
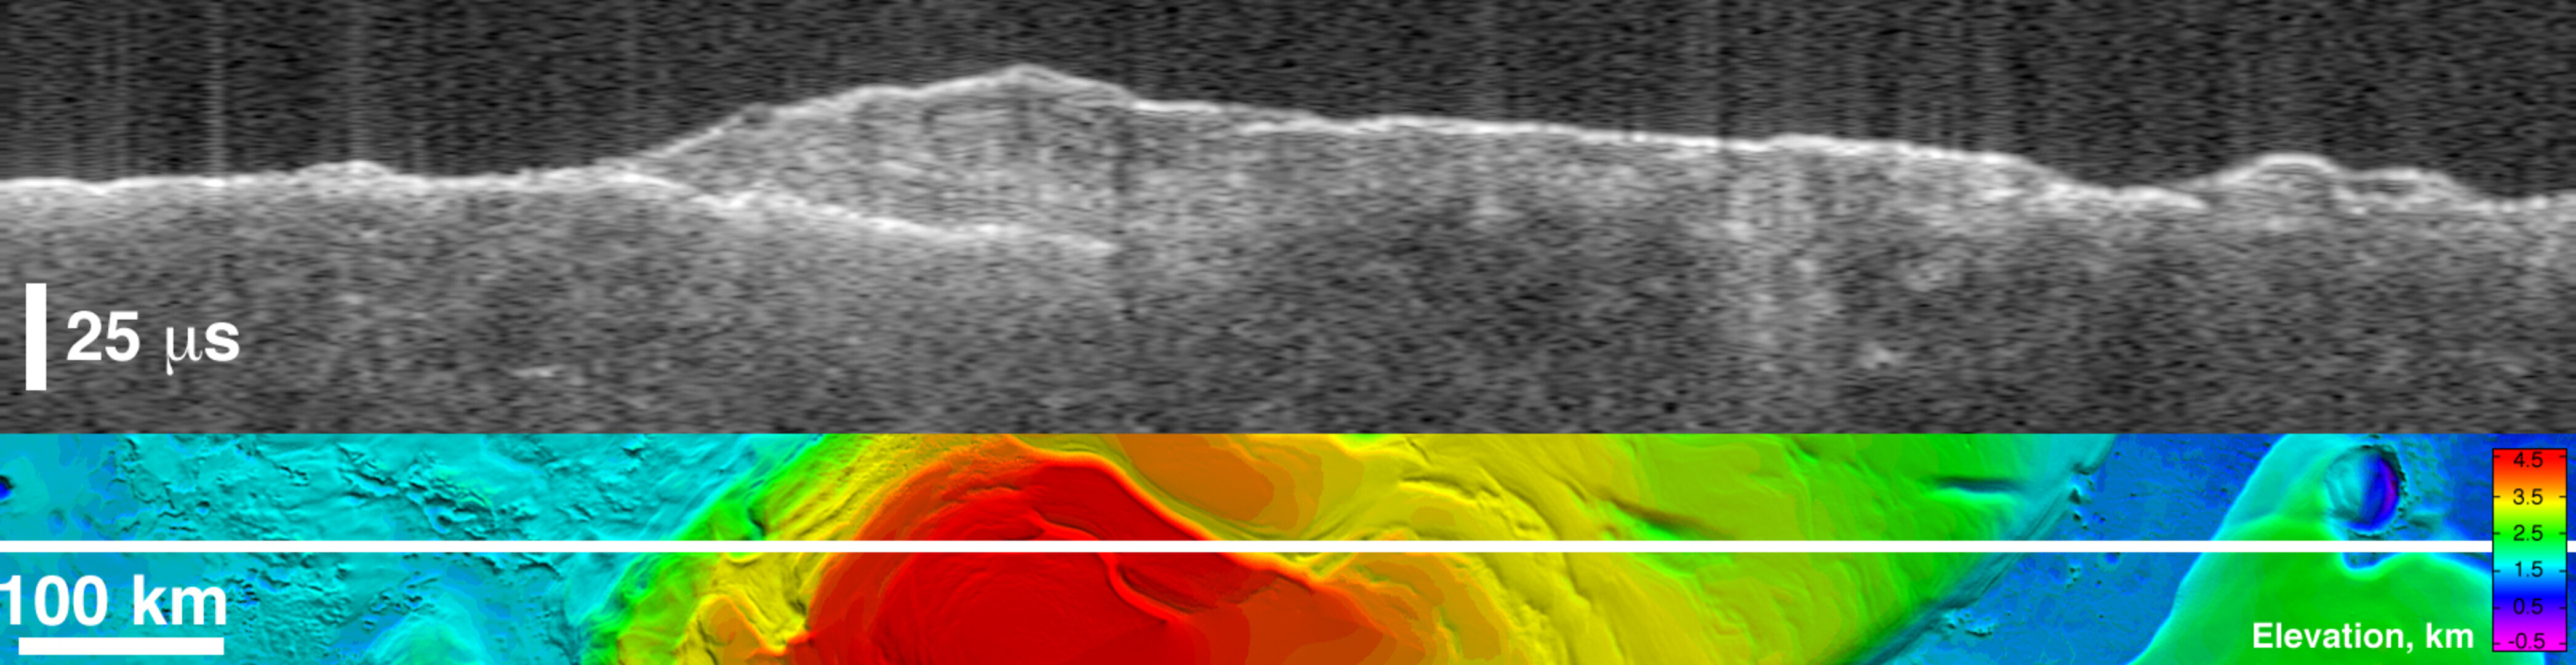
The upper image of this composite is a ‘radargram’ from the Mars Advanced Radar for Subsurface and Ionospheric Sounding (MARSIS) on board ESA’s Mars Express. It shows data from the subsurface of Mars in the water-ice-rich layered deposits that surround the south pole of the planet.
The lower image shows the position of the ground track of the spacecraft (indicated by a white line) on a topographic map of the area based on data from the MOLA laser altimeter on board NASA's Mars Global Surveyor. The images are 1250 kilometers wide. A non-annotated version of the image can be found here.
here.
The MARSIS radar echo trace splits into two traces on the left side of the image, at the point where the ground track crosses from the surrounding plains onto elevated layered deposits.
The upper trace is the echo from the surface of the deposits, while the lower trace is interpreted to be the boundary between the lower surface of the deposits and the underlying material.
The strength of the lower echo suggests that the intervening material is nearly pure water ice. Near the image center, the bright lower echo abruptly disappears for unknown reasons. The time delay between the two echoes reaches a maximum of 42 microseconds left of center, corresponding to a thickness of 3.5 kilometres of ice. The total elevation difference shown in the topographic map is about 4 kilometres between the lowest surface (purple) and the highest (red).

Lower boundary of icy layers covering Mars' south-po…

Virtual ‘slice’ through icy layered deposits near Ma…

Thickness of Mars' South Polar Layered Deposits

Upper surface of icy layers covering Mars' south-pol…
