About ESA
The European Space Agency (ESA) is Europe’s gateway to space. Its mission is to shape the development of Europe’s space capability and ensure that investment in space continues to deliver benefits to the citizens of Europe and the world.
Highlights


Latest


Space in Member States
Find out more about space activities in our 23 Member States, and understand how ESA works together with their national agencies, institutions and organisations.
 Germany
 Austria
 Belgium
 Denmark
 Spain
Spain
 Estonia
 Finland
 France
 Greece
 Hungary
 Ireland
 Italy
Italy
 Luxembourg
 Norway
 The Netherlands
 Poland
 Portugal
 Czechia
 Romania
 United Kingdom
 Slovenia
 Sweden
 Switzerland
Science & Exploration
Exploring our Solar System and unlocking the secrets of the Universe
Go to topicAstronauts


Latest


Enabling & Support
Making space accessible and developing the technologies for the future
Go to topicLatest


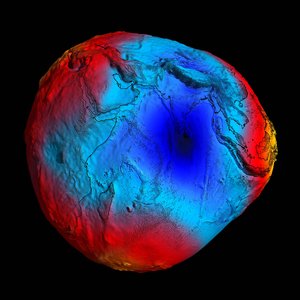
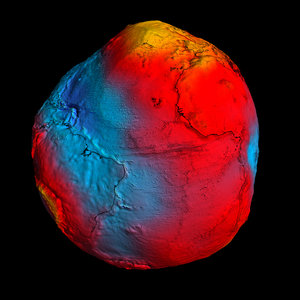
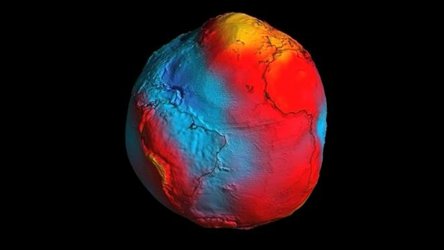
Sea slope
The red and blue dots show values of mean sea level (MSL) measured with respect to national datums in the US and Canada (red and blue, respectively). These data indicate that the height of the sea increases travelling north from Florida to Canada. However, most modern numerical models of ocean circulation (black dots) suggest that the slope of the sea should actually decrease travelling north and can be explained by the effects of the Gulf Stream in this region of the Atlantic Ocean. The new geoid from ESA’s GOCE gravity mission has resolved this long-debated mystery by providing conclusive proof that the height of the sea does, indeed, drop (yellow dots).