About ESA
The European Space Agency (ESA) is Europe’s gateway to space. Its mission is to shape the development of Europe’s space capability and ensure that investment in space continues to deliver benefits to the citizens of Europe and the world.
Highlights


Latest


Space in Member States
Find out more about space activities in our 23 Member States, and understand how ESA works together with their national agencies, institutions and organisations.
 Germany
 Austria
 Belgium
 Denmark
 Spain
Spain
 Estonia
 Finland
 France
 Greece
 Hungary
 Ireland
 Italy
Italy
 Luxembourg
 Norway
 The Netherlands
 Poland
 Portugal
 Czechia
 Romania
 United Kingdom
 Slovenia
 Sweden
 Switzerland
Science & Exploration
Exploring our Solar System and unlocking the secrets of the Universe
Go to topicAstronauts


Latest


Enabling & Support
Making space accessible and developing the technologies for the future
Go to topicLatest


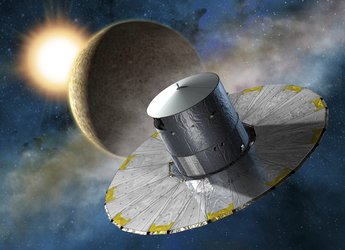
Gaia characterises dynamics of 10 000 variable stars
ESA's star-surveying Gaia mission has released a treasure trove of new data as part of its ‘focused product release’. One of the new papers characterises the dynamics of 10 000 pulsating and binary red giant stars in by far the largest such database available to date. These stars were part of a catalogue of two million variable star candidates released in Gaia DR3, and are key when calculating cosmic distances, confirming stellar characteristics, and clarifying how stars evolve throughout the cosmos. The new release provides a better understanding of how these fascinating stars change over time.
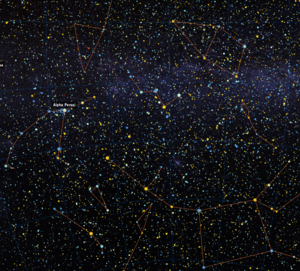
Each symbol on this skymap indicates the position of one of the sources from the catalogue. Each is colour-coded according to the star’s variability type as seen by Gaia. Red symbols are long-period variables (LPVs) whose variability is driven by the star pulsating. Green dots show so-called ‘long secondary period’ stars (LSPs), whose cause of variability is still debated but believed to be linked to a cloud of dust orbiting the star. Blue symbols are ellipsoidal variables: red giants that are part of a binary system with a dense compact object, and whose shape is distorted into an egg-like shape due to this companion’s strong gravitational pull. Each source changes in luminosity roughly periodically and has a varying line-of-sight velocity as measured by Gaia. This means that the stellar surface is either cyclically approaching or receding from us as the star pulsates, or that the star itself is approaching/receding as it moves throughout its orbit. The darker the tone and larger the size of each symbol, the more that star’s velocity changes throughout its cycle.
Alt-text: This image shows the plane of the Milky Way cutting horizontally across the frame, with many colourful dots overlaid – each representing a star. The dots are either red, green or blue, with the colour representing the star’s type and motion (the larger and darker the dot, the more the star’s velocity is changing throughout its cycle).
Acknowledgements: Michele Trabucchi, Nami Mowlavi and Thomas Lebzelter