Accept all cookies Accept only essential cookies See our Cookie Notice

About ESA
The European Space Agency (ESA) is Europe’s gateway to space. Its mission is to shape the development of Europe’s space capability and ensure that investment in space continues to deliver benefits to the citizens of Europe and the world.
Highlights
ESA - United space in Europe
This is ESA ESA facts Member States & Cooperating States Funding Director General Top management For Member State Delegations European vision European Space Policy ESA & EU Space Councils Responsibility & Sustainability Annual Report Calendar of meetings Corporate newsEstablishments & sites
ESA Headquarters ESA ESTEC ESA ESOC ESA ESRIN ESA EAC ESA ESAC Europe's Spaceport ESA ESEC ESA ECSAT Brussels Office Washington OfficeWorking with ESA
Business with ESA ESA Commercialisation Gateway Law at ESA Careers Cyber resilience at ESA IT at ESA Newsroom Partnerships Merchandising Licence Education Open Space Innovation Platform Integrity and Reporting Administrative Tribunal Health and SafetyMore about ESA
History ESA Historical Archives Exhibitions Publications Art & Culture ESA Merchandise Kids Diversity ESA Brand Centre ESA ChampionsLatest
Space in Member States
Find out more about space activities in our 23 Member States, and understand how ESA works together with their national agencies, institutions and organisations.
Science & Exploration
Exploring our Solar System and unlocking the secrets of the Universe
Go to topicAstronauts
Missions
Juice Euclid Webb Solar Orbiter BepiColombo Gaia ExoMars Cheops Exoplanet missions More missionsActivities
International Space Station Orion service module Gateway Concordia Caves & Pangaea BenefitsLatest
Space Safety
Protecting life and infrastructure on Earth and in orbit
Go to topicAsteroids
Asteroids and Planetary Defence Asteroid danger explained Flyeye telescope: asteroid detection Hera mission: asteroid deflection Near-Earth Object Coordination CentreSpace junk
About space debris Space debris by the numbers Space Environment Report In space refuelling, refurbishing and removingSafety from space
Clean Space ecodesign Zero Debris Technologies Space for Earth Supporting Sustainable DevelopmentLatest
Applications
Using space to benefit citizens and meet future challenges on Earth
Go to topicObserving the Earth
Observing the Earth Future EO Copernicus Meteorology Space for our climate Satellite missionsCommercialisation
ESA Commercialisation Gateway Open Space Innovation Platform Business Incubation ESA Space SolutionsLatest
Enabling & Support
Making space accessible and developing the technologies for the future
Go to topicBuilding missions
Space Engineering and Technology Test centre Laboratories Concurrent Design Facility Preparing for the future Shaping the Future Discovery and Preparation Advanced Concepts TeamSpace transportation
Space Transportation Ariane Vega Space Rider Future space transportation Boost! Europe's Spaceport Launches from Europe's Spaceport from 2012Latest

Kilonova emission spectrum
Thank you for liking
You have already liked this page, you can only like it once!
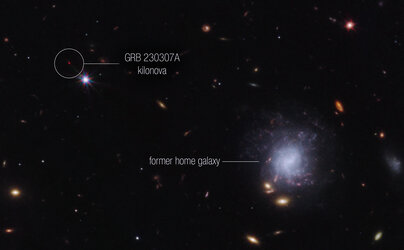
This graphic presentation compares the spectral data of GRB 230307A’s kilonova as observed by the James Webb Space Telescope and a kilonova model. Both show a distinct peak in the region of the spectrum associated with tellurium, with the area shaded in red. The detection of tellurium, which is rarer than platinum on Earth, marks Webb’s first direct look at an individual heavy element from a kilonova.
Though astronomers have theorised neutron star mergers to be the ideal environment to create chemical elements, including some that are essential to life, these explosive events – known as kilonovas – are rare and rapid. Webb’s NIRSpec (Near-Infrared Spectrograph) acquired a spectrum of GRB 230307A’s kilonova, helping scientists secure evidence of the synthesis of heavy elements from neutron star mergers.
With Webb’s extraordinary ability to look further into space than ever before, astronomers expect to find even more kilonovas and acquire further evidence of heavy element creation.
[Image description: The spectrum is plotted as a line graph of brightness versus wavelength of light (microns). The spectral lines range in wavelength of light along the x-axis, with the first tic labelled as '1.0' and the last tic labelled as '5.0', and in brightness, with the level of brightness becoming greater moving higher along the y-axis. The Webb spectral line is white and jagged. About a third of the way across the graph, there is a distinct peak between 2.0 and 2.5 microns. After 2.5 microns, the spectral line slopes gradually up to the right. The model spectral line is red and smoother than the Webb data. The model’s spectral line at 1.0 micron begins low (dim) and flat before peaking between 2.0 and 2.5 microns, similar to the Webb data. The area below the model spectral line is shaded red and labelled “Tellurium T E.” The model spectral line then descends after 2.5 microns and follows the general trend of the Webb data.]
-
CREDIT
NASA, ESA, CSA, J. Olmsted (STScI) -
LICENCE
CC BY 4.0 INT or ESA Standard Licence
(content can be used under either licence)

Kilonova and host galaxy

Kilonova and host galaxy (clean)

Webb finds water vapour, but from a rocky planet or…

Galaxy JADES-GS-z14-0 Spectrum


 Germany
 Austria
 Belgium
 Denmark
 Spain
Spain
 Estonia
 Finland
 France
 Greece
 Hungary
 Ireland
 Italy
Italy
 Luxembourg
 Norway
 The Netherlands
 Poland
 Portugal
 Czechia
 Romania
 United Kingdom
 Slovenia
 Sweden
 Switzerland


