Exercise 4: Hazard assessment: GIS can help!
Load the false colour composite 4-5-3 of the Landsat image of 2003 (File > Open) which you previously saved in this exercise. Then open the GIS Tool by selecting GIS > GIS Tools. In the menu of the GIS window go to File > Open Theme. The files that can be opened have the extension *.shp (‘shapefile’, which is a common vector format, while all other data used in this exercise is raster data).
Open the three shapefiles which you will find in the Etna_Landsat_GIS.zip folder:
- buildings.shp
- roads_detail.shp
- roads.shp
As transformation method for the first shapefile select:
- transformation method: UTM
- datum & Ellipsoid: WGS 84
- zone: 33
- hemisphere: North
For the next shapefiles you can simply choose Arbitrary and Map Based (for projected layers).
Move buildings to the top using the arrows.
Click on the coloured square in the GIS Tool window or go to Edit > Properties. Change the colour of roads_detail.shp to any colour clearly visible on the background image, e.g. yellow by clicking on Color and using the rulers for Red, Green and Blue. Be aware that RGB colours are additive colours (none = black, all = white). In case you want to mix yellow, set red and green to the maximum. Colour all the layers. A possible example could be the following:
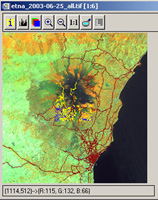
GIS data: roads, buildings and lava (of the 2001 eruption)
GIS data: roads, buildings and lava (of the 2001 eruption)
1. Why do you think a GIS database can be useful in cases of disaster?
2. Can you estimate which infrastructure was endangered by the lava in 2001?
3. If you can locate houses and roads near the summit, what do you think they could be for?
Open lava2001.shp and colour it. By zooming in you can now see the infrastructure affected and endangered by the lava.
4. Look at older lava flows (greenish coloured lava) and think about what damage they could now cause to the infrastructure.
You can also open the thermal band (band 6) of the 29.7.2001 image and display the lava-shape over it. You will see that although it fits quite well, it does not cover all parts of the lava shape.
|