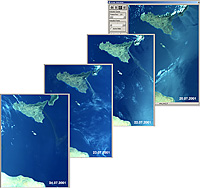
| | |  | Development of the volcanic plume, 20-24 July 2001 | |
Exercise 3: Monitoring a plume - animation
Create an animation from a sequence of MODIS images. We have an image from MODIS Terra for each of the four days (20, 22, 23 and 24 July) of the 2001 eruption. The images have been prepared because they must have the same pixel size, extent and projection, and must be stored in the same folder to create an animation.
Open the four images as an RGB with the band combination red = band 1, green = band 4, and blue = band 3, and stretch them, in the same way that we did for the image of 21 July 2001.
File > Open > R=1, G=4, B=3 > 201_1-4-3 > Enhance > Interactive Stretching
File > Open > R=1, G=4, B=3 > 203_1-4-3 > Enhance > Interactive Stretching
File > Open > R=1, G=4, B=3 > 204_1-4-3 > Enhance > Interactive Stretching
File > Open > R=1, G=4, B=3 > 205_1-4-3 > Enhance > Interactive Stretching
Then save them with the suffix _stretched:
File > Save As > 201_1-4-3_stretched,
File > Save As > 203_1-4-3_stretched,
File > Save As > 204_1-4-3_stretched,
File > Save As > 205_1-4-3_stretched.
Go to Tools > Image Animation.
Highlight the four stretched images that you just saved on your disk.
With the rulers on the left you can adjust the speed. We advise to put them to the left side (slower speed). That way you can see the evolution of the plume. If the images still look a bit different, apply interactive stretching to make them look more similar (see LEOWorks tutorial p. 78).
1. Think about the significance of wind speed and direction in the atmosphere which influences the movement of the volcanic plume.
2. Remember that we are not just looking at the Earth’s surface anymore. The plume can move between different heights of the atmosphere where wind conditions might be different.
| |