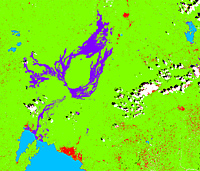
|  | Result of a supervised classification for the Landsat 2001 image | |
Exercise 2: Lava Detection using Supervised Classification - continued
The result should look like the image on the left.
| | | Re-coloured result of a supervised classification for the Landsat 2001 image |
The one with the manually changed colours should look like the image on the right.
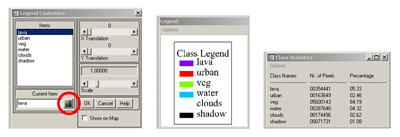
Legend customize window, Legend window, and Class statistics window
Three windows help visualise the results of the classification (see LEOWorks tutorial p. 57):
1) the Class statistics window shows the number of pixels and their percentage related to all the pixels of the image,
2) the Legend window shows the colours plus their description, and
3) the Legend customize window allows to change colours by clicking on the colour button (to better represent the ’real’ environment). To open the Legend window, click on ‘L’.
1. Study the classified result and try to interpret it.
2. Describe which features were assigned to which classes.
3. Can you see obvious errors where the algorithm did not perform very well?
4. Is volcanic lava sometimes wrongly classified?
5. What could you do to improve the classification result?
6. Compare the results to the 4-5-3 FCC.
You will notice that the algorithm did a pretty good job, but that there are some errors e.g. the coastal region around water bodies was often wrongly classified as lava or shadows, and cloud shadows were identified as urban areas in some cases. Volcanic lava was successfully detected, except in the city of Goma, where it was sometimes partly classified as urban (problem of mixed pixels).
Considering the landscape in this area, the resolution of 30 m is suitable for the detection of lava and the identification of larger urban centres. However, the resolution is not sufficient to detect streets, and causes wrong classification in urban areas, which could be crucial in the case of a disaster.
|