Changements côtiers Delta du DanubeMarées noiresDéforestation Parc National de BardiaBassin du CongoKameng-SonitpurLe KilimandjaroRondoniaShillong et GuwahatiLa Glace Analyse des glaciers avec l'imagerie radarAntarctica 2003Changement climatique et glaciersRetrait des glaciers dans les AlpesL'écoulement des masses glaciairesSurveillance des glaciers de l'HimalayaLa télédétection de la glace et de la neigeUrbanisation CórdobaLe CaireKatmandouL'HimalayaVallée de KatmandouLagosVégétation Aire de Conservation de l’AnnapurnaPerdus dans les AndesZone de Conservation du NgorongoroDelta intérieur du NigerAmérique du Sud
|  | | | | | | | Article Images |  |
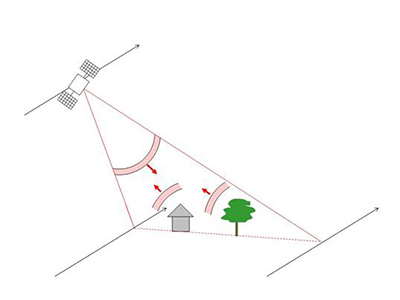
Radar à synthèse d'ouverture (RSO)
| | | | | North is to the left. For location and orientation, see the GoogleEarth file location 3.3.
Credits: Andreas Kääb | |  |  | |
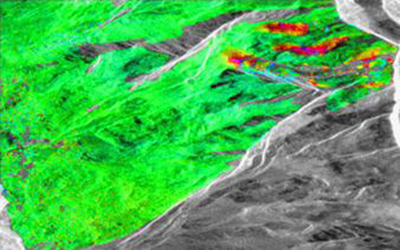
| | | | | North is at the top, meaning the viewing direction from above is from left to right on the interferogram. The interferogram displays the phase differences as the distances from the satellite to the ground on 7 and 8 March 1996, as measured by the ERS SAR sensor.
Credits: T. Strozzi, GAMMA Remote Sensing, Switzerland | | | | |
| | | | | Black areas are removed because the terrain is too steep in these areas to be properly seen in the SAR images.
Credits: T. Strozzi, GAMMA Remote Sensing, Switzerland | | | | |
| | | | |
Credits: T. Strozzi, GAMMA Remote Sensing, Switzerland | | | | |
| |
| | Analyse des glaciers avec l'imagerie radar IntroductionContexte RadarExercices Feuille de travailExercice 1 : Données radar multi-temporelles et données optiques multi-spectralesExercice 2 : L'influence des conditions climatiques sur l'imagerie radarConclusionsEduspace - Software LEOWorks 4 (MacOS)LEOWorks 4 (Windows)LEOWorks 4 (Linux)Eduspace - Download Images_Glaciers.zipGoogleEarth file
|