Exercise 1: NDVI - Vegetation from space
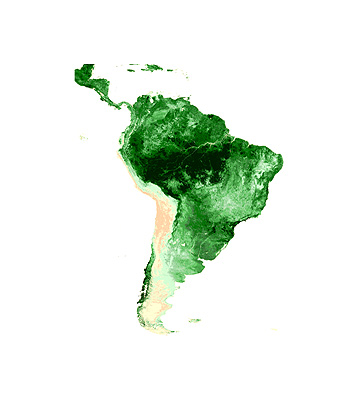
Vegetation can be monitored from space with the help of satellite sensors. Using the level of reflection of the red part of the electromagnetic spectrum and of the near infrared, a vegetation index (NDVI) can be calculated from the pixels in the image. The result can be visualised using a colour scale that goes from brown to dark green.
This introductory exercise compares and analyses two NDVI images of Latin America from January and August with the help of maps showing precipitation levels. This exercise does not require the use of LeoWorks.

SPOT NDVI January 2000
 SPOT NDVI August 2000
When a satellite distinguishes between different surfaces, it senses radiation or reflection within specific wavelength regions, also known as channels, which are typical of the spectral signatures of these surfaces.
The images used in this exercise were taken by SPOT, the French satellite system. The SPOT Vegetation Programme consists of two observation instruments in orbit, VEG 1 and VEG 2, as well as ground infrastructure. The first of the two instruments in orbit is aboard the SPOT 4 satellite, launched in 1998. The second is aboard SPOT 5, placed into orbit in 2002.
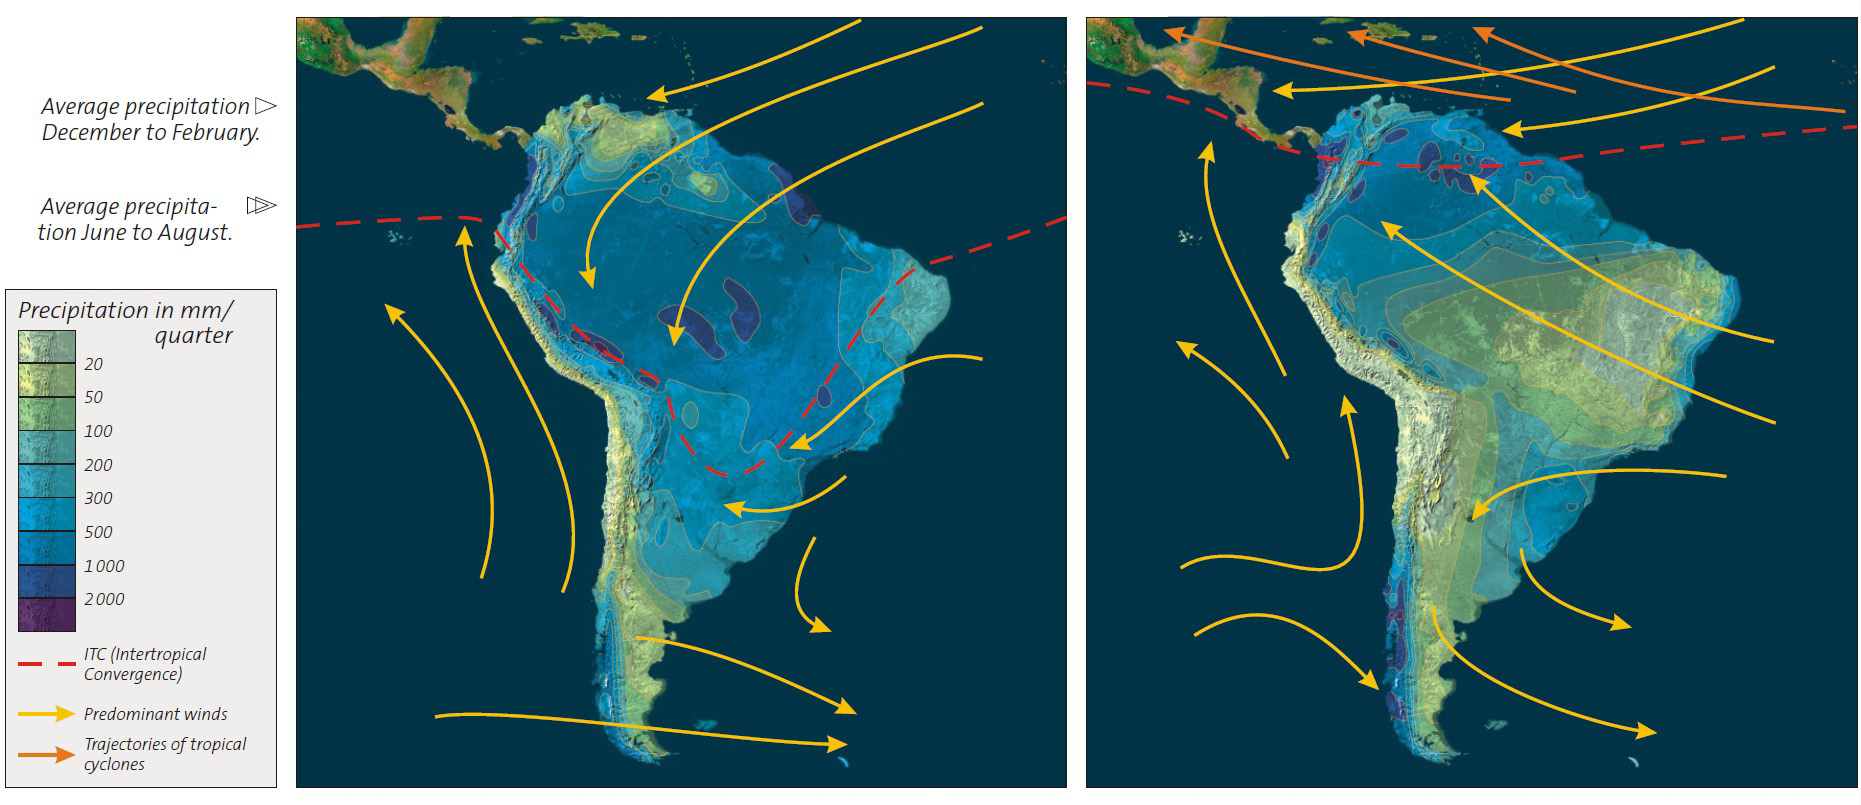
The presence and abundance of vegetation is a result of many physical geographical parameters of which precipitation is one of the most important.
1. Describe the two NDVI images.
2. Where do you find the most abundant vegetation?
3. Where do you find the least abundant vegetation?

Precipitation Dec to Feb
 Precipitation June to Aug
4. Compare the precipitation maps for the two seasons and try to explain the changes in vegetation from January to August.
5. Find some areas where there is much variation in the NDVI. By comparing the NDVI with the precipitation maps can you explain the variations?
6. Find some desert areas. Can you explain why precipitation is so low in these areas?
7. There are some areas with high NDVI values in both seasons. Can you explain why?
|