| | Exercise 3 - Part 2
Air Pollution of Kathmandu Valley Case Study Worksheet excercise 3. This excercise is divided into two parts and requires the use of LEOWorks.
Example
We have done the analysis of the Putalisadak monitoring station for you. See the tables and graphs below.
Monitoring Station - Putalisadak
Putalisadak, Graph 1
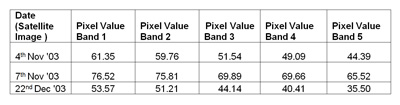
First we constructed a graph from the different reflectance values, that is, the reflectance curve for the different days. In case of the 4 November image, the highest digital number is found in band 1 (61) and the lowest DN value is found in band 5 (44).
On the 7 November image, the highest DN value of 76 is found in band 1, and the lowest DN value is found in band 5. On the 22 December image, the highest DN value is found in band 1 and the lowest DN value is found in band 5.
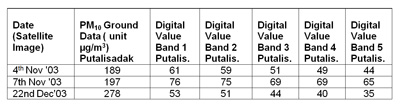
Putalisadak: P10 versus Digital Values
1. Assess the correlation (at least graphically) between PM10 and DN values of band 1 to band 5 of all the images at the other 5 stations.
2. Make your conclusions based on your findings using satellite data for air pollution monitoring. Discuss the feasibility of comparing a point measurement (P10 measurement) with the surface measurement of the satellite integrating about 300 m x 300 m.
3. Would you like to do the same for your town? Then get in touch with us and we will provide you with satellite data! Our address is: eduspace@esa.int
Further hints for the discussion on the limitation of our study:
- Impact of the meteorological factors such as wind velocity, micro-climatology, temperature inversion, etc. have not been considered. These factors might have a significant role in the dispersal of air pollutants.
- Only the PM10 parameter has been taken as an air pollutant indicator. However, other pollutant parameters may significantly contribute to polluting the air, but these parameters have not been included. We assume that high PM10 values also mean high pollution values in general.
- Only three satellite image data sets have been used.
- PM10 data is of 24 hours accumulation, whereas satellite image data is a snap of time in the morning (08.28 Kathmandu time).
- Satellite data measurements are mainly influenced by ground reflection, which changes during the year. However, in our case (winter), the changes are minor.
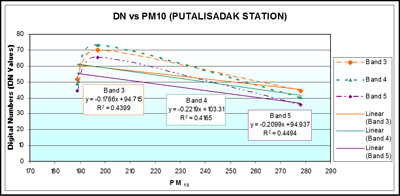
Putalisadak Graph 2
Putalisadak Graph 2.1
From the figures Graph 2a and Graph 2b of the Putalisadak monitoring station, we can again observe the general increase of satellite values from band 5 to band 1. The correlation to PM10 is not high. It is, however, highest for band 1, (R2=0.5916). All of this means that in this case, band 1 seems to have the best correlation between DN values and PM10. A first hypothesis is therefore that band 1 could be our best option to assess air quality. In order to prove or disprove this preliminary hypothesis, we have to look at the data of the other stations, as well as their respective satellite readings.
| |