| | Urbanisation – Detection by means of delineation of the city perimeter - Part 2
Page 1 1 2 2
This exercise is divided into two parts and requires the use of LEOWorks.
The objective of this exercise is to quantitatively assess the surface growth of Lhasa from 1965 to 2000. We will do this by digitising the perimeter of the city in the 1965, 1988, and 2000 images. In the two black-and-white images, Lhasa_1965 and Lhasa_2000_3m, the built-up area is easy to distinguish, but in the two Landsat multispectral images we first have to train ourselves in order to correctly interpret the urban area on the Landsat colour images. We also have to decide which band combination is best suited to do this job.
Find out by comparing the 321, 432, 543 and 753 band combination for both 1988 and 2000 with the black and white images, and decide which is the best (for example, the 321 for 1988 and 753 for the year 2000).
Now let's digitise the city perimeter.
First we must open the file lhasa_1965 of Worksheet 2.
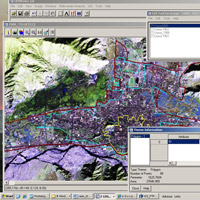
Then click the GIS button and on the GIS Tool for image… click on File>New Theme. Name the Theme 'Lhasa_1965', and select Type of Theme - Polygon. OK.
Edit>Start Edit.
Now carefully digitise the area around the city, including all the quarters as far as they are on the image. Right click to close the polygon.
Edit>Stop Edit.
File>Save Theme (save it in the Worksheet 3 directory) under the name 'Lhasa_1965'.
Continue by opening your choice of the 1988 band combination (e.g. 1988_321). If you have to re-open the image, do not forget to apply Enhance>Histogram Equalization!
Click on the GIS button. File>New Theme, etc.
Digitise the town limit in the 1988 image. If you have doubts about the colours, always consult the black and white images of 1965 and 2000_3m! It is rather easy to spot common city areas in all the images.
At the end, Save the polygon as 'Lhasa_1988'.
Now take your choice of the 2000 band combination and digitise the city area again. Save it as 'Lhasa_2000'.
 Lhasa city perimeters
Now let's display the other polygons on the 2000 image.
File>Open Theme – double-click on 'Lhasa_1965.shp'. Transformation Method: Arbitrary. Load mode: Map Based.
Give the polygon another colour: Edit>Properties. Click on the colour bar and select, for example, yellow.
Do the same for 'Lhasa_1988' – but give the polygon a different colour and inspect the three polygons.
Now we want to know the area of each.
Click on 'Lhasa_1965' on the GIS for image…- window.
Click Tool>Information. This will highlight the polygon. Now read in the Theme Information window the number of pixels for the 'Area'.
This number has to be multiplied by the surface of one pixel, which is 28.5 m x 28.5 m (you get it by clicking "i" on the image window).
In the same way, find the surface of the city in 1988 and in 2000.
1. Compare the resulting surfaces in 1965, 1988, and 2000. How much has the urbanised surface grown? Find numbers regarding the growth of cities in your country to compare.
Inspect 'lhasa_2000_3m.tif' again and observe the very many white oblong structures, mostly appearing in series of buildings. These are greenhouses! Make the effort to thoroughly digitise their total surface. You need to do it in many polygons (just within one single Theme, of course). In order to get the total surface of all polygons within a theme, you have to add them up manually and multiply the sum with the pixel surface (3 m x 3 m).
2. What is the total surface of the greenhouses, and what is the relationship between urban areas and greenhouses?
3. Discuss the reasons for constructing so many greenhouses near Lhasa at an altitude of 3650 m, taking into consideration the amount of hours of Sun, the availability of water, the habit of nutrition, and immigration.
Page 1 1 2 2
| |

