Exercise 1: Multitemporal radar and multispectral optical data
Start the LEOWorks software and Open the asar_29feb2008.tif, asar_13june2008.tif and 26sept2008.tif images (Images_Glaciers.zip) as a single dataset. Display the image of 29 feb 2008.
Use Inspect > Information, or the [ i ]-button to see technical information about the images.
How many pixels is the image in height and width? What ground area does one pixel cover? How many kilometres does this make the image in height and width?
Familiarise yourself with the image. Use the zoom, etc.
Can you find the airstrip of Ny Ålesund?
Write down its geographic position using Inspect > Pixel Info.
Use the Measure Tool to measure some distances. Make sure that you have the Units in the Measure Tool menu bar set to Meters.
How long is the airstrip? How far is it from Ny Ålesund (which lies close to the airstrip) to the front of the Kronebreen glacier? How wide are the calving fronts of Kronebreen and other glaciers?
In addition to the radar images, load the Landsat TM image of 23 July 2006. Open > tm_23july2006.tif. View > New RGB View… Display band 1 in Blue, band 2 in Green and band 3 in Red. Improve the image using Interactive Stretching. You can use the Landsat image for better orientation of the radar images. Describe the differences between the optical and radar images. Use Synchronise compatible product views and Synchronise cursor position.
Display and explore all three radar images.
On which date do the glaciers appear brighter? On which date do they appear darker? Is that true for all glacier parts, or is this temporal variation different for different glacier parts?
Choose three different glacier sections on the images and write down if the radar image is relatively bright, medium, or dark. Choose a point on the lower part of the big Kronebreen glacier, another on the lower part of a small glacier, and yet another on the upper part of a small glacier. You can then make a simple table like this one:
| | Radar image 29 February 2008 | Radar image 13 June 2008 | Radar image 26 September 2008 | | Kronebreen lower part | bright | | | | Small glacier lower part | | dark | | | Small glacier upper part | | bright | |
|
What is the difference between the three dates for the three sites? What values do others find in your class? Can you explain the differences?
Inspect the Histogram of the three different radar images.
How do they differ from each other?
Create an animation with the three images you have. Under Tools > Animation, select the February, June and September images and run the animation. Follow the change in reflectivity for certain points. Adjust the Animation Speed as appropriate. Alternatively, pause the animation using the pause button || and go stepwise through the images.
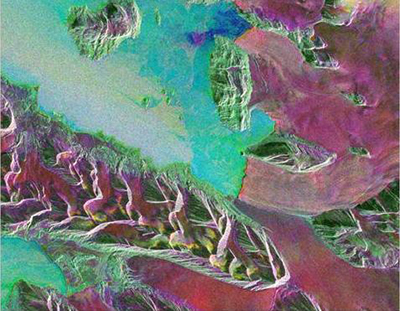
Close the animation and create a multi-temporal image (View > New RGB View…) Set the 29 Feb image as Red, the 13 June image as Green and the 26 Sept image as Blue. The resulting image should look like the one below.
Red indicates that the 29 Feb image (Red) is brightest in this combination, green indicates that the 13 June image (Green) is brightest, blue that the 26 Sept image (Blue) is brightest.
Yellow is a mixture of red and green.
What do yellow colours in the RGB composite tell you? Where do you find yellow on the composite image? Do you think it would be possible to map the glacier outlines from this RGB composite?
Describe the glacier distribution and compare it with the Landsat TM image. Find places where the glacier boundaries look similar, and where they differ between the ASAR and TM data.
|